Spatial Analysis For Conservation and Sustainability
Biodiversity
Species richness varies by orders of magnitude across the globe and so does the richness of endangered species. We are interested in both the macroecological processes causing richness patterns, and the socioeconomic processes determining where biodiversity is threatened.
During the breeding season, Kirtland’s Warblers (Setophaga kirtlandii) are strongly associated with young jack pine (Pinus banksiana) forests in northern Lower Michigan, USA. Since 2007, the species has been breeding in unusual habitat, red pine (Pinus resinosa) dominated plantations, in central Wisconsin, USA. Kirtland’s Warbler productivity and habitat use in red pine is not well understood, and the central Wisconsin population is at a range edge, a situation often associated with lower productivity. To compare range-edge and range-core populations, we estimated reproductive success and characterized habitat use of Kirtland’s Warblers in central Wisconsin red pine-dominated plantations during 2015–2017 using logistic regression models. We also monitored nests and fledgling success, and estimated nest survival using logistic exposure models. Trees were closer together and herbaceous vegetation was taller and denser within territories than at randomly located points outside of territories. Females selected nest sites with deeper dead ground vegetation and live vegetation that was taller and denser than was available at randomly located points within male territories. Nest success was not strongly influenced by within-patch habitat factors. Nest daily survival rate was 0.97 (95% CI = 0.94–0.98). The average number of young fledged per nest was between 2.5 and 2.8. Nest parasitism by Brown-headed Cowbirds (Molothrus ater) was 22.7%. Overall, reproductive success in the peripheral central Wisconsin breeding population of Kirtland’s Warblers that used red pine-dominated plantations was similar to that of Kirtland’s Warblers breeding in typical jack pine habitat in the range core. Young red pine-dominated habitat appears to approximate young jack pine in habitat quality for Kirtland’s Warblers, and this may provide managers some flexibility in habitat maintenance for this conservation-reliant species.
The niche-based argument that species are filtered from environments in which they cannot sustain viable populations is the basis of the Richness-Heterogeneity Relationship (RHR). However, the multi-dimensionality of niches suggests that the RHR may take different shapes along different environmental axes, with potential confounding effects if filtering along the axes is not equally strong. Here, we explore how different structural and landscape variables drive the RHR as the accumulative outcome of environmental preferences at the species-level while considering the intercorrelation between heterogeneity levels along three niche axes. We used occurrence data of avifauna from 226 sites situated along a grassland-to-woodland gradient in a Midwestern USA study area. In each site, we quantified horizontal (habitat cover type), vertical (vegetation height structure), and spatial (habitat configuration) heterogeneity and explored the shape of the observed RHR at the landscape scale, as well as the correlations among heterogeneity levels at different axes. We then fitted species distribution models to environmental variables from the three axes separately and compared the stacked probabilities of occurrences of all species to the observed species richness. We found that predictions of richness patterns improved when more than one heterogeneity axis was included in RHR models, and that habitat suitability along different axes is not equally strong. Furthermore, a unimodal RHR along the vegetation height axis, which the species distribution models revealed to be a weak predictor for most species, may arise through intercorrelation with heterogeneity along the two other axes, along which we recorded stronger signals of environmental preference at the species level. Our results emphasize the importance of selecting relevant niche axes in studies of species richness patterns because ultimately, these patterns reflect the various environmental preferences of individual species.
Bird species richness is highly dependent on the amount of energy available in an ecosystem, with more available
energy supporting higher species richness. A good indicator for available energy is Gross Primary Productivity
(GPP), which can be estimated from satellite data.
Our question was how temporal dynamics in GPP affect bird species richness. Specifically, we evaluated the
potential of the Dynamic Habitat Indices (DHIs) derived from MODIS GPP data together with environmental and
climatic variables to explain annual patterns in bird richness across the conterminous United States. By focusing
on annual DHIs, we expand on previous applications of multi-year composite DHIs, and could evaluate lag-effects
between changes in GPP and species richness.
We used 8-day GPP data from 2003 to 2013 to calculate annual DHIs, which capture three aspects of vegetation
productivity: (1) annual cumulative productivity, (2) annual minimum productivity, and (3) annual
seasonality expressed as the coefficient of variation in productivity. For each year from 2003 to 2013, we
calculated total bird species richness and richness within six functional guilds, based on North American
Breeding Bird Survey data.
The DHIs alone explained up to 53% of the variation in annual bird richness within the different guilds
(adjusted deviance-squared D2adj = 0.20–0.52), and up to 75% of the variation (D2adj = 0.28–0.75) when
combined with other environmental and climatic variables. Annual DHIs had the highest explanatory power for
habitat-based guilds, such as grassland (D2adj = 0.67) and woodland breeding species (D2adj = 0.75). We found
some inter-annual variability in the explanatory power of annual DHIs, with a difference of 5–7 percentage
points in explained variation among years in DHI-only models, and 3–7 points for models combining DHI,
environmental and climatic variables. Our results using lagged year models did not deviate substantially from
same-year annual models.
We demonstrate the relevance of annual DHIs for biodiversity science, as effective predictors of temporal
variation in species richness patterns. We suggest that the use of annual DHIs can improve conservation planning,
by conveying the range of patterns of biodiversity response to global changes, over time.
Protected areas safeguard biodiversity and provide opportunities for human recreation. However, abundant anthropogenic food subsidies associated with human activities in protected areas can lead to high densities of generalist predators, posing a threat to rare species at broad spatial scales. Reducing anthropogenic subsidies could curb populations of overabundant predators, yet the effectiveness of this strategy is unclear. We characterized changes in the foraging ecology, body condition, and demography of a generalist predator, the Steller’s jay, three years after implementation of a multi-faceted management program to reduce anthropogenic subsidies in a protected area in California. Stable isotope analysis revealed that the proportional contribution of anthropogenic foods to jay diets declined from 88% to 47% in response to management. Overlap between jay home ranges decreased after management began, while home range size, body condition, and individual fecundity remained stable. Adult density in subsidized areas decreased markedly from 4.33 (SE: ±0.91) to 0.65 (±0.20) jays/ha after the initiation of management, whereas density in unsubsidized areas that were not expected to be affected by management remained stable (0.70 ± 0.22 pre-management, 0.58 ± 0.38 post-management). Thus, the response of jays to management was density-dependent such that reduced densities facilitated the maintenance of individual body condition and fecundity. Importantly, though, jay population size and collective reproductive output declined substantially. Our study provides evidence that limiting anthropogenic subsidies can successfully reduce generalist predator populations and be part of a strategy to increase compatibility of species protection and human recreation within protected areas.
Understanding human influence on ecosystems and their services is crucial to achieve sustainable development and ensure the conservation of biodiversity. In this context, the human footprint index (HFI) represents the anthropogenic impacts on ecosystems and the natural environment. Our objective was to characterize the HFI in Southern Patagonia (Argentina) across the landscape, qualifying the differences among the main ecological areas and especially the forested landscapes. We also assessed the potential utility of HFI to identify priority conservation areas according to their wilderness quality and potential biodiversity values. We created a HFI map (scores varied from 0 representing high wilderness quality to 1 representing maximum human impact) using variables related to direct (e.g. infrastructure) and indirect (e.g. derived from economic activities) human impacts, including settlements, accessibility, oil industry, and sheep production. HFI varied significantly across the natural landscapes, being lower (0.07 0.11) in remote ecosystems close to the Andes Mountains and higher (0.38 0.40) in southern areas close to the provincial capital city. Forested landscapes presented different impact values, which were directly related to the economical values of the different forest types. We determined that the current protected area network is not equally distributed across the different ecological areas and forest types. Priority conservation areas were also identified using the fragmentation produced by the human impact, the patch size, and the potential biodiversity values. HFI can present high compatibility with other land-use management decision making tools, acting as a complement to the existing tools for conservation planning or management.
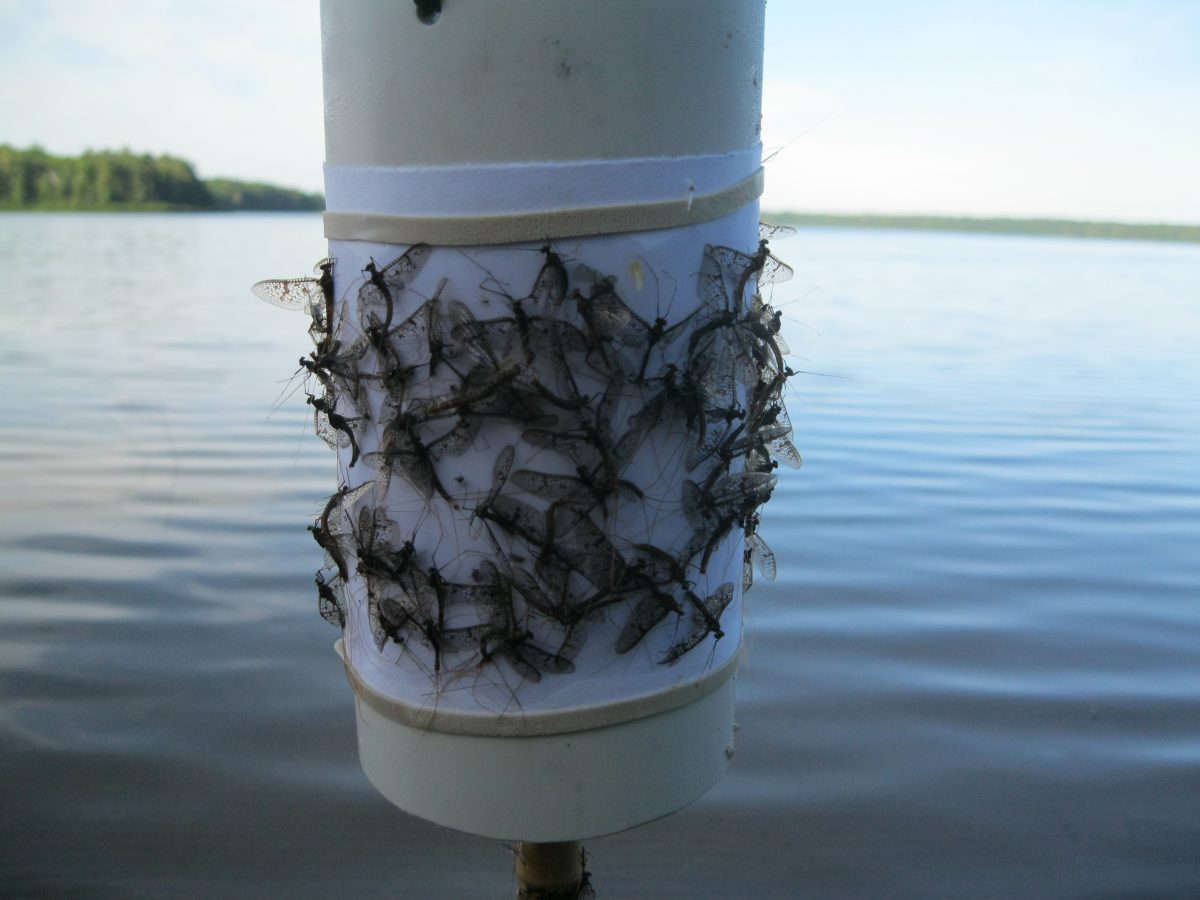
Considering their outsized importance as prey for so many species one would assume that patterns of insect abundance and their determinants have been well-studied. On the contrary, insect ecology is poorly understood and documented. Our study sought to gain an understanding of the subgroup of insects that fly, with a particular emphasis on groups that spend part of their life in lakes and streams.
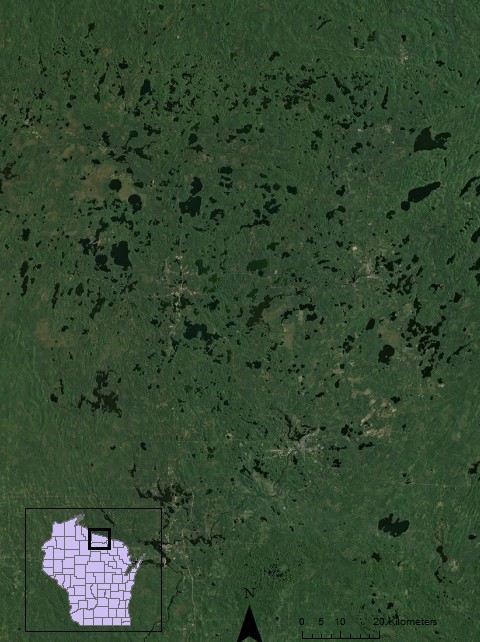
Insect trapping took place in the northern highland lake district. The study area consists of northern mixed forest with one of the highest densities of lakes in the world.
We conducted insect trapping over three years in the forest landscape of northern Wisconsin, near UW-Madison’s Trout Lake Research Station. We trapped insects May-August around five different lakes and identified them in the lab.
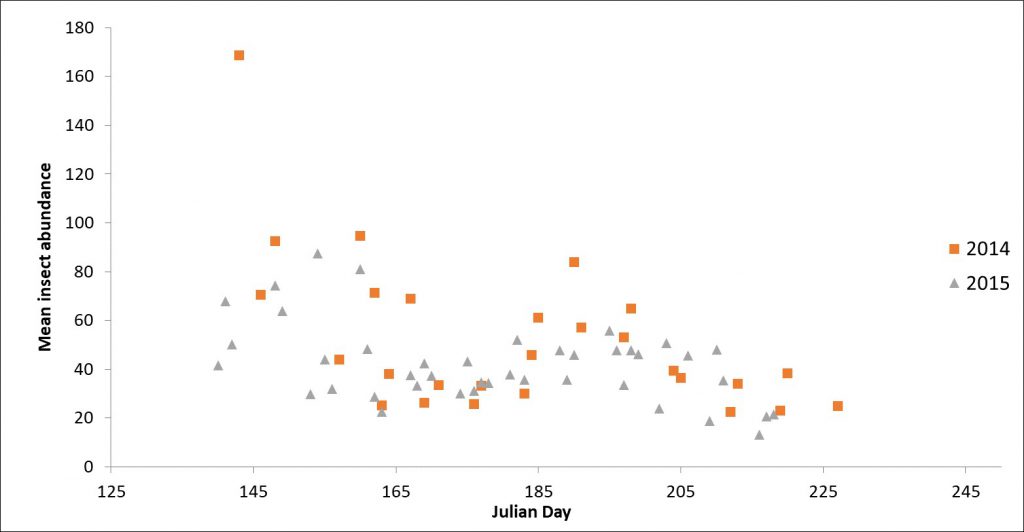
Mean insect abundance varied over the course of the summer with peak average insect abundance occurring in late May and early June (Julian Day 145-155) in both years.
There were several patterns that stood out. Flying insects tended to be many times more abundant in nearshore areas compared to interior forests. Different groups of insects showed different patterns. Diptera, including deerflies, midges, and gnats were the most abundant insects overall. As expected, emergent aquatic groups such as midges, mayflies, and dragonflies were more abundant in nearshore areas while beetles and thrips were more abundant in forest interiors. There were also multiple peaks of abundance through the season with large emergence events of midges and mayflies driving much of the pattern. In addition, local canopy cover was negatively correlated with insect abundance.
We observed birds, bats, and fish consuming flying insects. Abundance of these insect predators likely tracks the abundance of their insect prey. In addition, insects perform other ecosystems services such as pollination and nutrient cycling. Understanding the patterns and drivers of insect abundance can help us better understand northern Wisconsin forest ecosystems.
Prioritizing candidate areas to achieve species richness representation is relatively straightforward when distributions are known for many taxa; however, it may be challenging in data-poor regions. One approach is to focus on the distribution of a few charismatic species in areas that overlap with areas with little human influence, and another is to expand protection in the vicinity of existing protected areas. We assessed the effectiveness of these two approaches for protecting the potential distribution of 21 bird species affiliated with the piedmont dry forest in Argentina. We assessed the degree to which current protected areas met the representation target for each bird species. We found that 8% of the piedmont dry forest and 11% of the extent of occurrence of the bird species within piedmont dry forest were protected, indicating a shortfall. Areas with little human influence that overlap with the distribution of charismatic species had a higher number of bird species than areas with high human influence. Areas within the vicinity of protected areas performed similarly to priority areas, but included high human influence areas. We suggest that a prioritization scheme based on areas of charismatic species distribution that overlap with areas of low human influence can function as an effective surrogate for bird species affiliated with the piedmont dry forest in Argentina. Our results have operational implications for conservation planning in those regions of the world where biodiversity data are poor, but where decisions and actions to sustain biodiversity are urgently needed.
Over the course of a year, vegetation and temperature have strong phenological and seasonal patterns, respectively, and many species have adapted to these patterns. High inter-annual variability in the phenology of vegetation and in the seasonality of temperature pose a threat for biodiversity. However, areas with high spatial variability likely have higher ecological resilience where inter-annual variability is high, because spatial variability indicates presence of a range of resources, microclimatic refugia, and habitat conditions. The integration of inter-annual and spatial variability is thus important for biodiversity conservation. Areas where spatial variability is low and inter-annual variability is high are likely to limit resilience to disturbance. In contrast, areas of high spatial variability may be high priority candidates for protection. Our goal was to develop spatiotemporal remotely sensed indices to identify hotspots of biodiversity conservation concern. We generated indices that capture the inter-annual and spatial variability of vegetation greenness and land surface temperature and integrated them to identify areas of high, medium, and low biodiversity conservation concern. We applied our method in Argentina (2.8 million km2), a country with a wide range of climates and biomes. To generate the inter-annual variability indices, we analyzed MODIS Enhanced Vegetation Index (EVI) and Land Surface Temperature (LST) time series from 2001 to 2018, fitted curves to obtain annual phenological and seasonal metrics, and calculated their inter-annual variability. To generate the spatial variability indices, we calculated standard deviation image texture of Landsat 8 EVI and LST. When we integrated our inter-annual and spatial variability indices, areas in the northeast and parts of southern Argentina were the hotspots of highest conservation concern. High inter-annual variability poses a threat in these areas, because spatial variability is low. These are areas where management efforts could be valuable. In contrast, areas in the northwest and central-west are where protection should be strongly considered because the high spatial variability may confer resilience to disturbance, due to the variety of conditions and resources within close proximity. We developed remotely sensed indices to identify hotspots of high and low conservation concern at scales relevant to biodiversity conservation, = which can be used to target management actions in order to minimize biodiversity loss.
Environmental heterogeneity enhances species richness by creating niches and providing refugia. Spatial variation in climate has a particularly strong positive correlation with richness, but is often indirectly inferred from proxy variables, such as elevation and related topographic heterogeneity indices, or derived from interpolated coarsegrain weather station data. Our aim was to develop new remotely sensed metrics of relative temperature and thermal heterogeneity, compare them with proxy measures, and evaluate their performance in predicting species richness patterns. We analyzed Landsat 8’s Thermal Infrared Sensor data, calculated two thermal metrics during summer and winter, and compared their seasonal spatial patterns with those of elevation and topographic heterogeneity. We fit generalized least squares models to evaluate each variable’s effect in predicting seasonal bird richness using data from the North American Breeding Bird Survey. Generally speaking, neither elevation nor topographic heterogeneity were good proxies for temperature or thermal heterogeneity, respectively. Relative temperature had a non-linear relationship with elevation that was negatively quadratic in summer, but slightly positively quadratic in winter. Topographic heterogeneity had a stronger positive relationship with thermal heterogeneity in winter than in summer. The magnitude and direction of elevation–temperature and topographic heterogeneity–thermal heterogeneity relationships in each season also varied substantially across ecoregions. Remotely sensed metrics of relative temperature and thermal heterogeneity improved the predictive performance of species richness models, and both thermal variables had significant effects on bird richness that were independent of elevation and topographic heterogeneity. Thermal heterogeneity was positively related to total breeding bird richness, migrant breeding bird richness and resident bird richness, whereas topographic heterogeneity was negatively related to total breeding richness and unrelated to migrant or resident bird richness. Because thermal and topographic heterogeneity had contrasting seasonal patterns and effects on richness, they must be carefully contextualized when guiding conservation priorities.
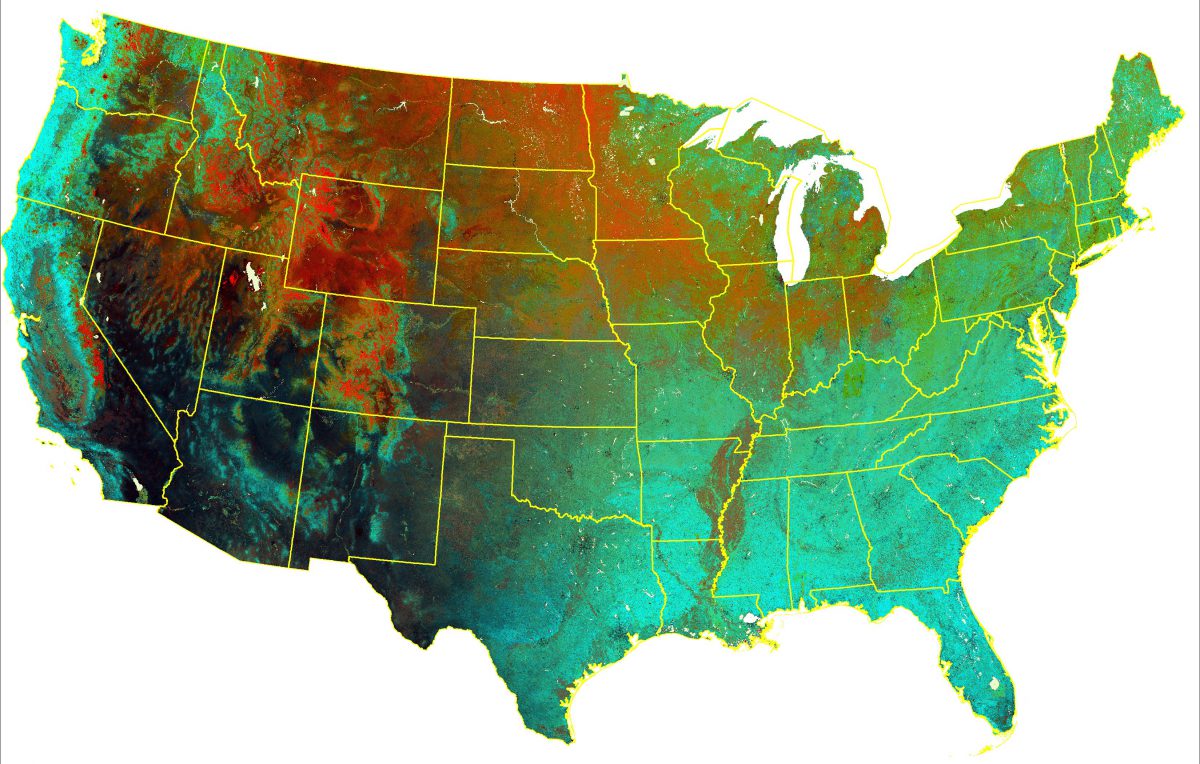
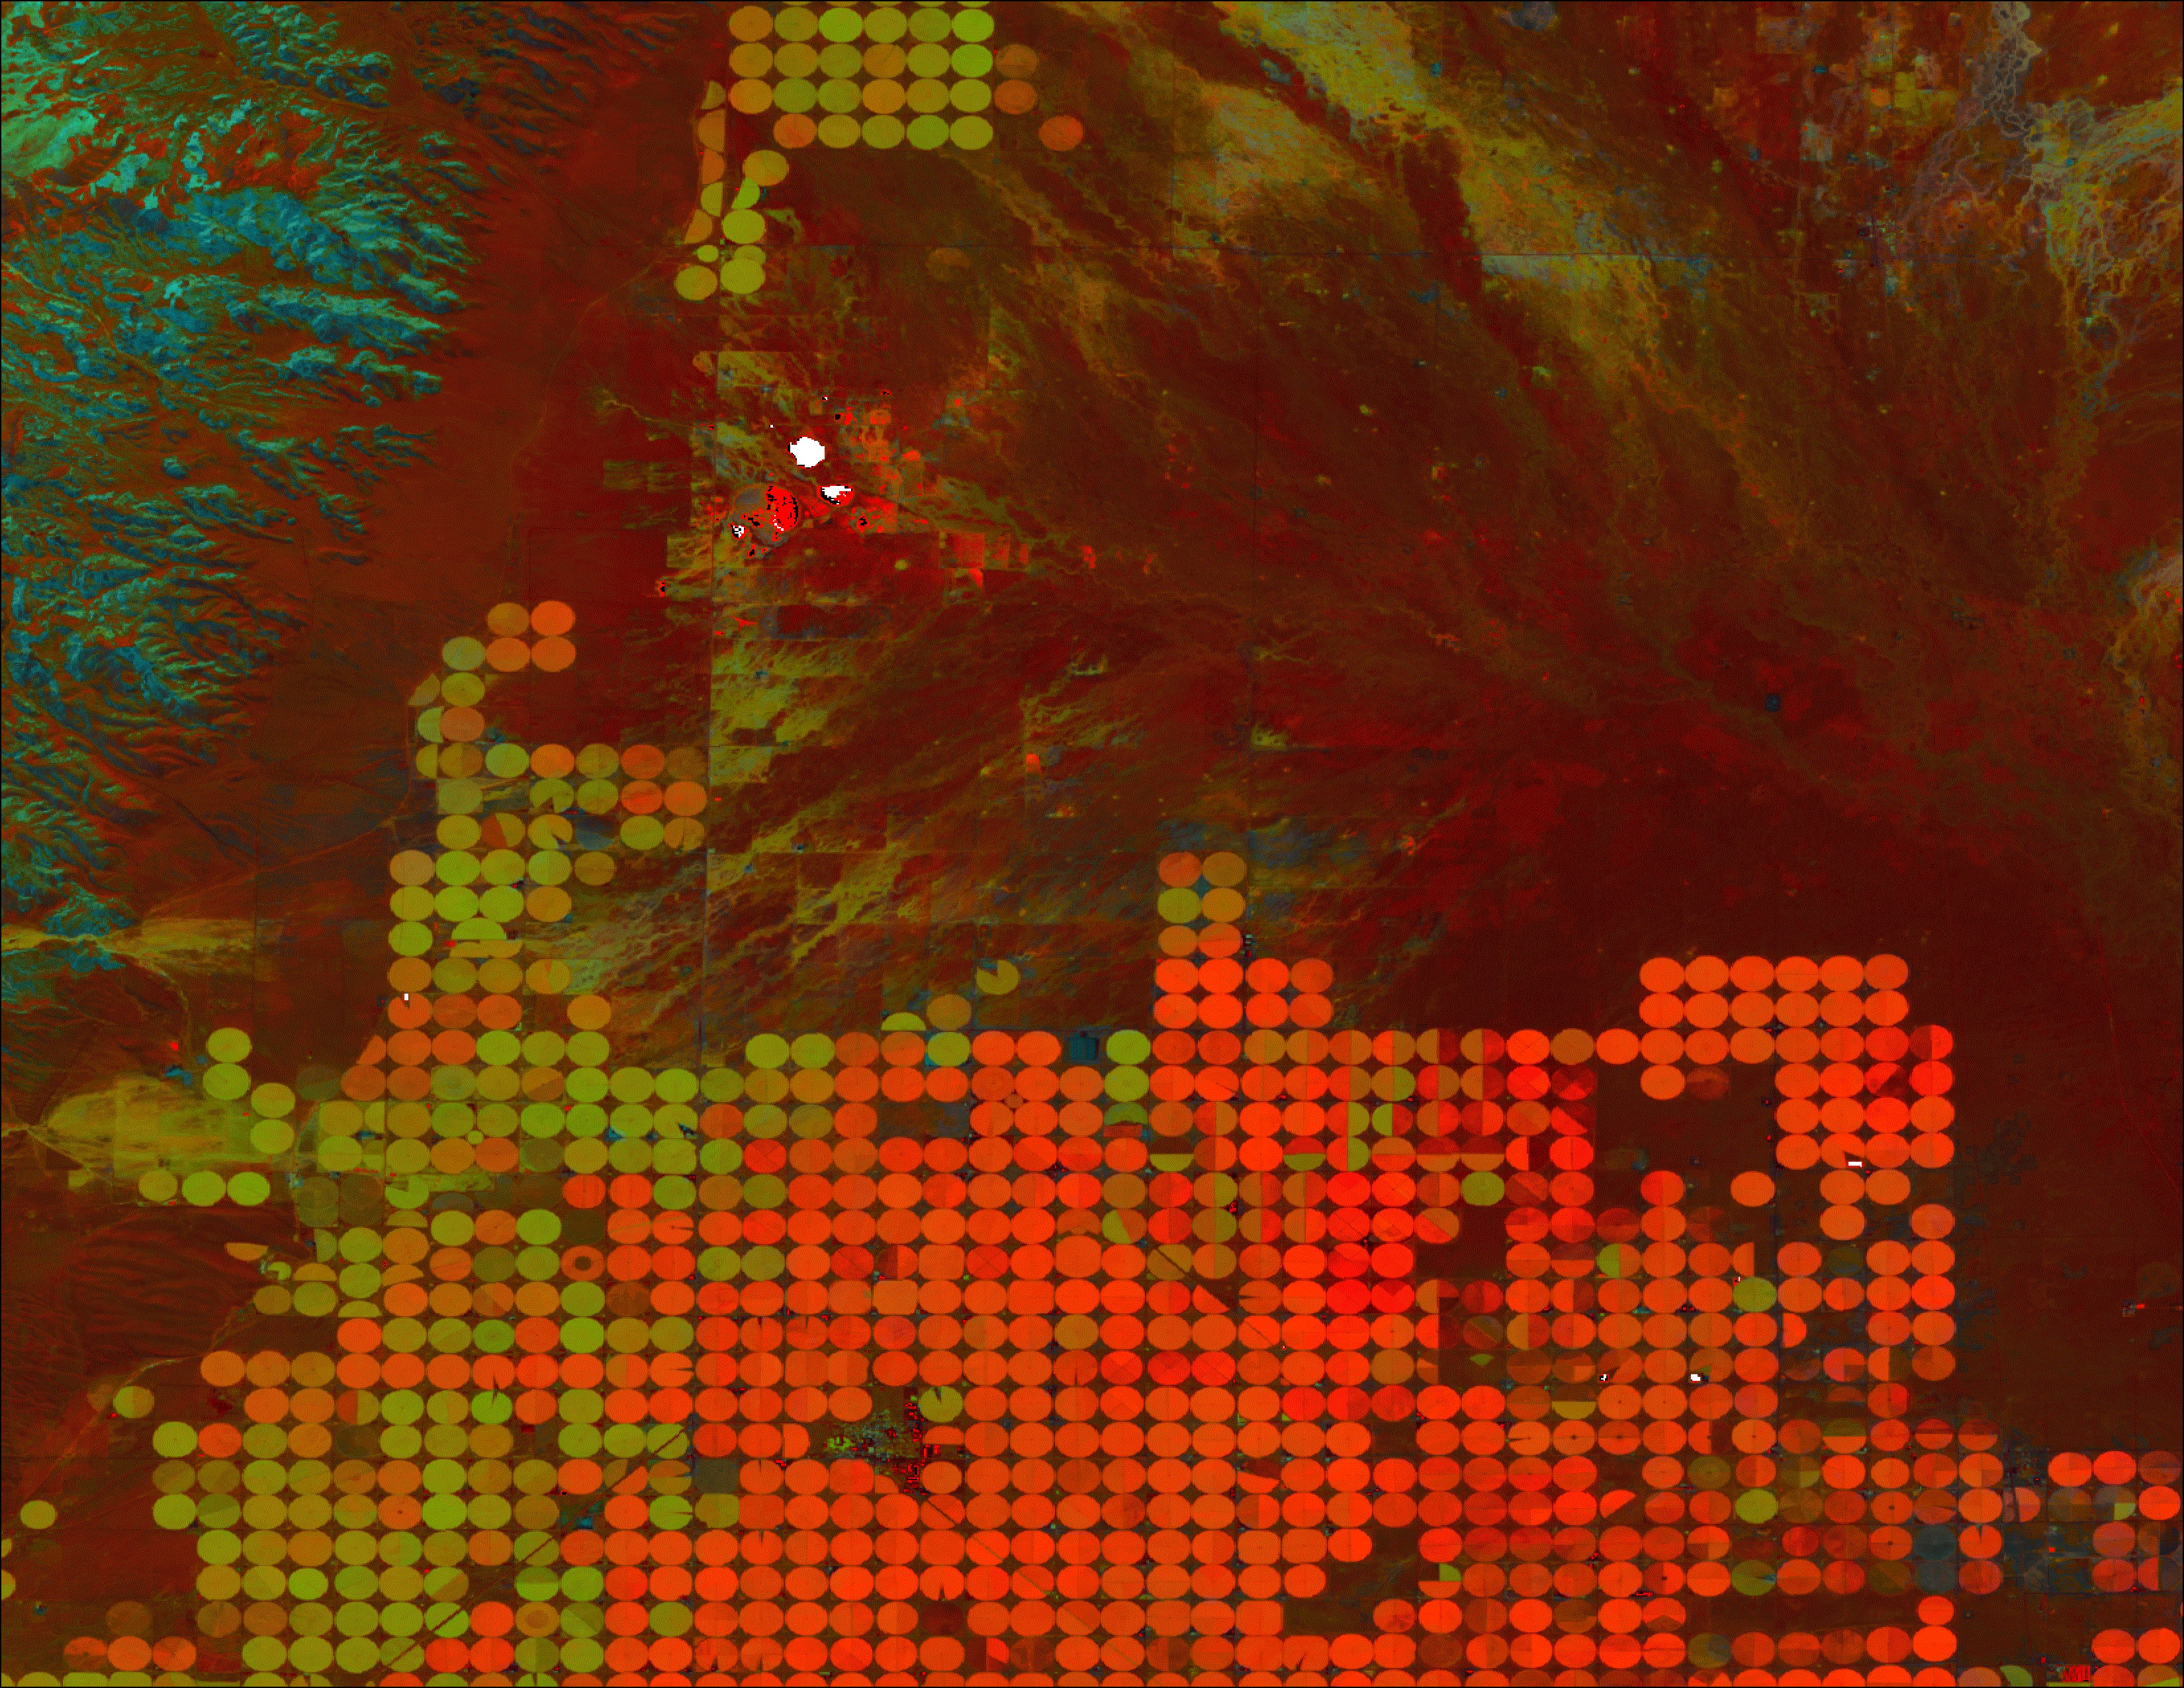
Human activity cause major changes to the planet and biodiversity is declining at an alarming rates. In order to prevent biodiversity loss, conservation actions require to assess current status of biodiversity to better understand and predict future changes, to identify the major drivers of biodiversity patterns, and to map biodiversity patterns. However, monitoring biodiversity over large areas is challenging to do in the field. Remote sensing provides the opportunity to develop indices that are designed for biodiversity assessment, because satellite data are collected systematically across broad scales. Vegetation productivity is one of the important determinants of species richness and density across broad scale. Vegetation indices derived from satellite data are a good proxy for vegetation productivity over broad areas. The Dynamic Habitat Indices (DHIs) summarize the three different aspects of vegetation productivity: cumulative productivity, minimum productivity, and seasonality in the way that it became relevant for biodiversity (Hobi et al., 2017; Radeloff et al., 2019; Razenkova et al., 2020). However, so far the DHIs have only been derived from coarse-resolution satellite imagery, which limits their value for management decisions.
The DHIs based on Landsat 8 in Colorado US, spatial resolution 30-m.The DHIs based on MODIS in Colorado US, spatial resolution 1-km.
Our goal is to develop the DHIs using medium-resolution Landsat imagery for monitoring biodiversity and abundance pattern across the conterminous United States. The main advantage is that imagery with medium resolution provides more detailed information about the spatial patterns of productivity. Our rationale was that the DHIs with higher spatial resolution could capture the difference in vertical structure of vegetation and characterize habitat heterogeneity at much finer scale, especially in complex mountainous terrain and areas with fragmented land cover. Having this crucial information in my hand, will help to understand how species respond to anthropogenic modification of landscapes, which disturb the integrity of landscape pattern. However, the temporal resolution of Landsat is low, and that creates a lot of challenges for the calculation of the DHIs.
We will develop the DHIs for the conterminous United States and test the usefulness of the DHIs for explaining the avian species richness and abundance pattern. Our study covers a wide range of ecoregions, and has diverse climatic zones and topography, resulting in a large number of habitats and large ranges of the DHIs. Moreover, rich datasets for bird richness and abundance are available for the US, particularly the western US. Our research will add more understanding to the importance of higher spatial resolution for characterizing the DHIs metrics and consequently for modeling biodiversity and individual species pattern. Moreover, our work will add more knowledge about drivers of avian diversity across broad spatial extents that can be used to predict how biodiversity patterns will change in the future depending on changes in vegetation productivity.