As humanity is facing the double challenge of species extinctions and climate change, designating parts of forests as protected areas is a key conservation strategy.1–4 Protected areas, encompassing 14.9% of the Earth’s land surface and 19% of global forests, can prevent forest loss but do not do so perfectly everywhere. 5–12 The reasons why protection only works in some areas are difficult to generalize: older and newer parks, protected areas with higher and lower suitability for agriculture, and more and less strict protection can be more effective at preventing forest loss than their counterparts.6,8,9,12–16 Yet predicting future forest loss within protected areas is crucial to proactive conservation. Here, we identify an early warning sign of subsequent forest loss, based on forest loss patterns in strict protected areas and their surrounding landscape worldwide, from 2000 to 2018.17,18 We found that a low level in the absolute forest cover immediately outside of a protected area signals a high risk of future forest loss inside the protected area itself. When the amount of forest left outside drops to <20%, the protected area is likely to experience rates of forest loss matching those in the wider landscape, regardless of its protection status (e.g., 5% loss outside will be matched by 5% loss inside). This knowledge could be used to direct funding to protected areas threatened by imminent forest loss, helping to proactively bolster protection to prevent forest loss, especially in countries where detailed information is lacking.
File: mmc3.pdf
Secondary cavity nesters, bird species that rely on the presence of existing cavities, are highly vulnerable to anthropogenic and stochastic processes that reduce the availability of cavity bearing trees. The most common logging practice in Neotropical forests is selective logging, where a few valuable tree species are logged, primarily old, large trees that are the most prone to develop cavities and produce larger amounts of fruits and seeds. Tucuman Amazon, Amazona tucumana, is a threatened parrot that relies on the tree-cavities and food provided by large, old trees. Our objective was to evaluate how logging affects 1) stand and nest plot forest structure, 2) nesting site selection, 3) food availability, 4) density of suitable cavities, 5) nest density, and 6) nest spatial pattern of Tucuman Amazon by comparing a mature undisturbed forest in a National Park (NP) vs a logged forest (LF). We determined the availability of suitable cavities and food resources consumed by Tucuman Amazon, and we compared nest density and spatial pattern of nests between NP vs LF. The Index of food availability for all tree species consumed by Tucuman Amazon and for P. parlatorei were significantly higher in NP than in LF (34.5 ±13.3 m ha− 1 vs. 3.5 ± 1.0 m ha− 1 and 5.6 ± 2.3 m ha− 1 vs. 1.2 ± 1.0 m ha− 1, respectively). Density of suitable cavities for nesting in the NP was significantly higher than in the LF: 4.6 cavities ha− 1 [C.I. 95 %: 3.07 – 7.04 cavities ha− 1] vs. 1.1 cavities ha− 1 [C.I. 95 %: 0.73 – 1.66 cavities ha− 1], respectively. Mean density of Tucuman Amazon nests was significantly higher in the NP than in LF (0.25 ± 0.04 vs. 0.06 ± 0.04 nest ha− 1, respectively). Food availability is an important factor that affects Tucuman Amazon populations and when food is not limiting, the availability of suitable cavities and territorial behavior could play a role in regulating nest density. When evaluating the limiting factors for secondary cavity-nesting species of conservation concern it is important to evaluate the interplay of a set of potential limiting factors to propose sound forest management recommendations.
File: Rivera-et-al-2022_Effect-of-logging-on-Tucumon-Amazon.pdf
Grasslands are important for global biodiversity, food security, and climate change analyses, which makes mapping and monitoring of vegetation changes in grasslands necessary to better understand, sustainably manage, and protect these ecosystems. However, grassland vegetation monitoring at spatial and temporal resolution relevant to land management (e.g., ca. 30-m, and at least annually over long time periods) is challenging due to complex spatio-temporal pattern of changes and often limited data availability. Here we assess both shortand long-term changes in grassland vegetation cover from 1987 to 2019 across the Caucasus ecoregion at 30-m resolution based on Cumulative Endmember Fractions (i.e., annual sums of monthly ground cover fractions) derived from the full Landsat record, and temporal segmentation with LandTrendr. Our approach combines the benefits of physically-based analyses, missing data prediction, annual aggregations, and adaptive identification of changes in the time-series. We analyzed changes in vegetation fraction cover to infer the location, timing, and magnitude of vegetation change episodes of any length, quantified shifts among all ground cover fractions (i.e., green vegetation, non-photosynthetic vegetation, soil, and shade), and identified change pathways (i.e., green vegetation loss, desiccation, dry vegetation loss, revegetation green fraction, greening, or revegetation dry fraction). We found widespread long-term positive changes in grassland vegetation (32.7% of grasslands), especially in the early 2000s, but negative changes pathways were most common before the year 2000. We found little association between changes in green vegetation and meteorological conditions, and varied relationships with livestock populations. However, we also found strong spatial heterogeneity in vegetation dynamics among neighboring fields and pastures, demonstrating capability of our approach for grassland management at local levels. Our results provide a detailed assessment of grassland vegetation change in the Caucasus Ecoregion, and present an approach to map changes in grasslands even where availability of Landsat data is limited.
File: 1-s2.0-S2666017221000225-main.pdf
Conserving the remaining wildest forests is a top priority for conservation, and human footprint maps are a practical way to identify wild areas. However, available global assessments of wild areas are too coarse for land use decisions, especially in countries with high deforestation rates, such as Argentina. Our main goal was to map the human footprint in Argentina’s forested areas to improve conservation planning at regional and country levels. Specifically, we quantified the level of human influence on the environment and mapped the wildest native forests (i) across forest regions, and (ii) in the different land-use categories of the National Forest Plan, which is a key policy instrument for conserving the nation’s native forests through zoning, and (iii) identified wildest forests that are at risk due to human activities. We analyzed detailed spatial data on settlements, transportation, energy, and land use change, and estimated the areal extent to which these various human activities disrupt natural processes. We defined pixels with human footprint index of zero as wildest areas. We found that a substantial portion (43%) of Argentina’s forested area remains wild, which suggests there are opportunities for conservation. However, levels of human influence varied substantially among forest regions, and Atlantic and Chaco forests have the highest levels of human influence. Further, we found that the National Forest Plan does not conserve the wildest forests of the nation, as most (78%) of the wildest native forests are located in zones that allow silvopasture, timber production, and/or forest conversion to crops, thus potentially threatening biodiversity in these areas. Our map of wildest forests is an important, but first, step in identifying wildland forests in Argentina, as available spatial data layers of human activities capture many, but not all, human influences on forests. For instance, small human features, like certain rural roads, trails, and rural settlements exist in our wildest areas. Our study provides new datasets to assist land use planners and conservationists, and identifies areas for conservation attention in Argentina. More broadly, our analyses highlight the value of detailed human footprint data to support conservation decisions in forest landscapes.
File: Martinuzzi-et-al_2021_HF-Argentina.pdf
Every year, wildfires destroy thousands of buildings in the United States, especially in the rapidly growing wildland-urban interface, where homes and wildland vegetation meet or intermingle. After a wildfire there is a window of opportunity for residents and public agencies to re-shape patterns of development, and avoid development in locations that are inherently at higher risk of wildfire destruction. We examined 28 of the most destructive wildfires in California, the state where most buildings are destroyed by wildfires, to evaluate whether locations of rebuilt and newly constructed buildings were adaptive (i.e., if building occurred in lower risk areas). In total, these fires burned 7,075 buildings from 1970 to 2009. We found minimal evidence for adaptation both in the number and placement of buildings post-fire. Rebuilding was common: 58% of the destroyed buildings were rebuilt within three to six years, and 94% within thirteen to twenty-five years after the fire. Similarly, we found minimal trends toward lower risk areas in the placement of 2,793 rebuilt and 23,404 newly constructed buildings over the course of 13–25 yr. In fact, long-term data revealed that relative risk of new construction either did not change significantly over time or increased. A destructive wildfire could provide an opportunity to assess and change building practices, yet our results show that such change is largely not occurring. As wildfires increasingly threaten communities, this lack of change could result in growing rates of destruction and loss of life.
File: Kramer_etal_2021_LUP.pdf
Maps are a key instrument and important data source for a wide range of research from global modeling to detailed ecological studies of a specific species. However different scales of tasks require proper instruments including a suitable maps detalization. For instance, a scientist who is interested in the general trends of agriculture abandonment may not have to pay too much attention to which specific fields are not in use anymore. However, for a conservation biologist studying a rare species, detailed maps of habitats, such as abandoned crops, is critical. However, it is difficult to make such detailed maps for large areas. Global maps are many, but they lack necessary details, while fine-scale maps only cover small areas if they exist at all. Unfortunately, using inappropriate scale of the input information either makes the results too general to be sensible or leads to incorrect conclusions.
In practical terms, precise mapping is a matter of balance of time and efforts versus the desired quality of results. The more accurate is a map the more resources are required to make it. But the amount of the resources necessary for creating a good map for a large area may be beyond what project managers can afford.
Coming back to the abandonment and land cover mapping, the maps are important for a variety of tasks including economic (re)development, nature conservation, and agriculture improvements. Thus, the absence of proper maps could make ecological and economic problems even worse.
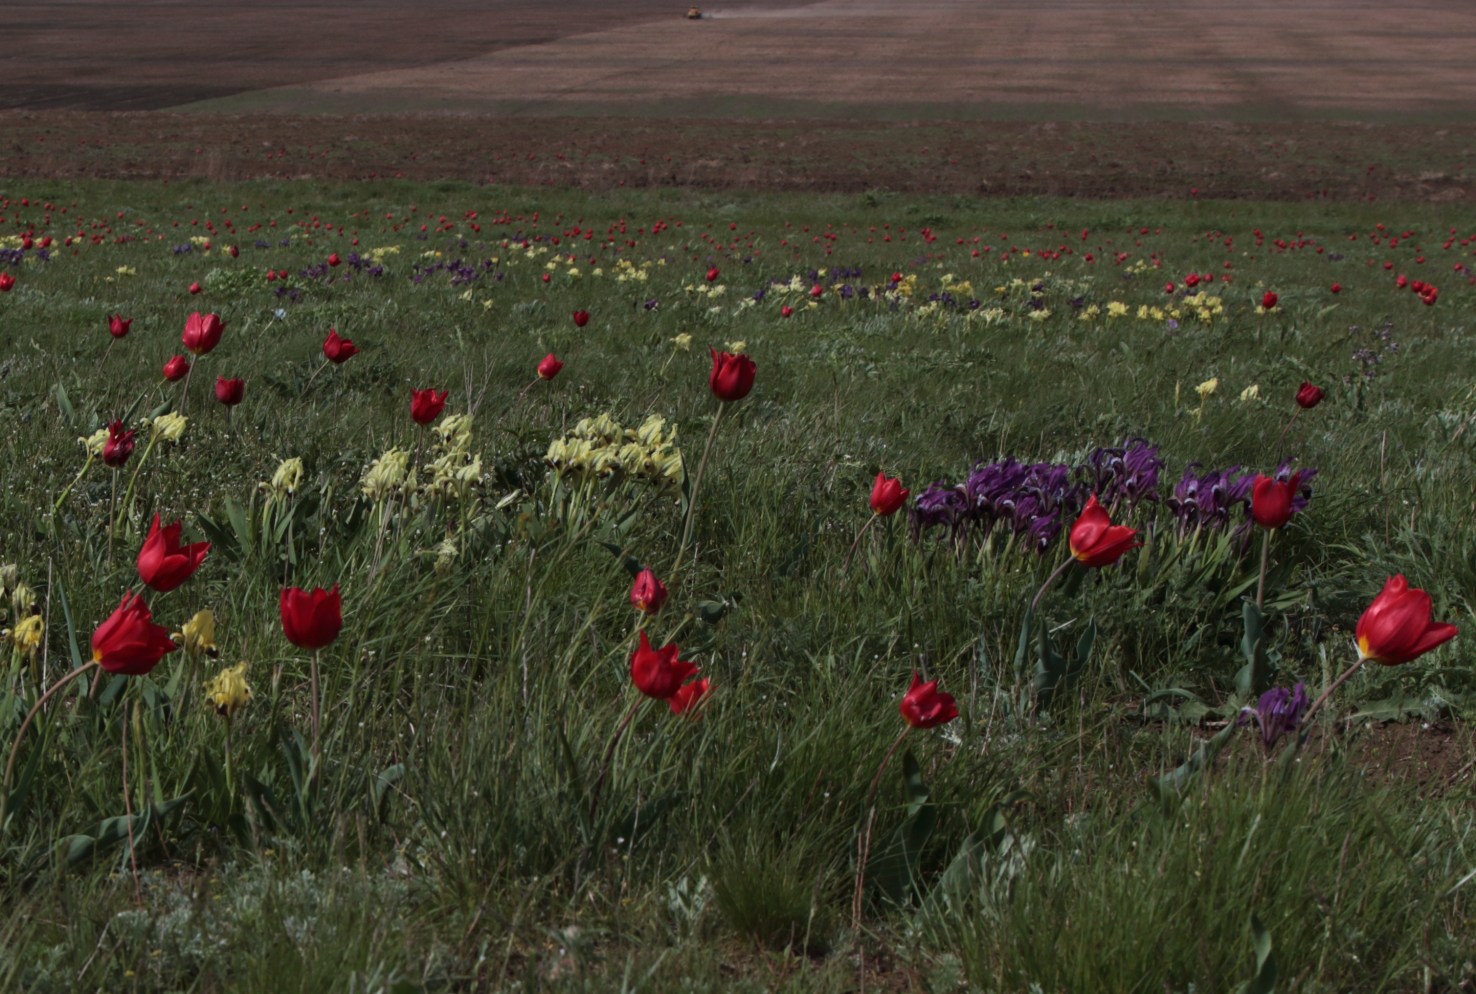
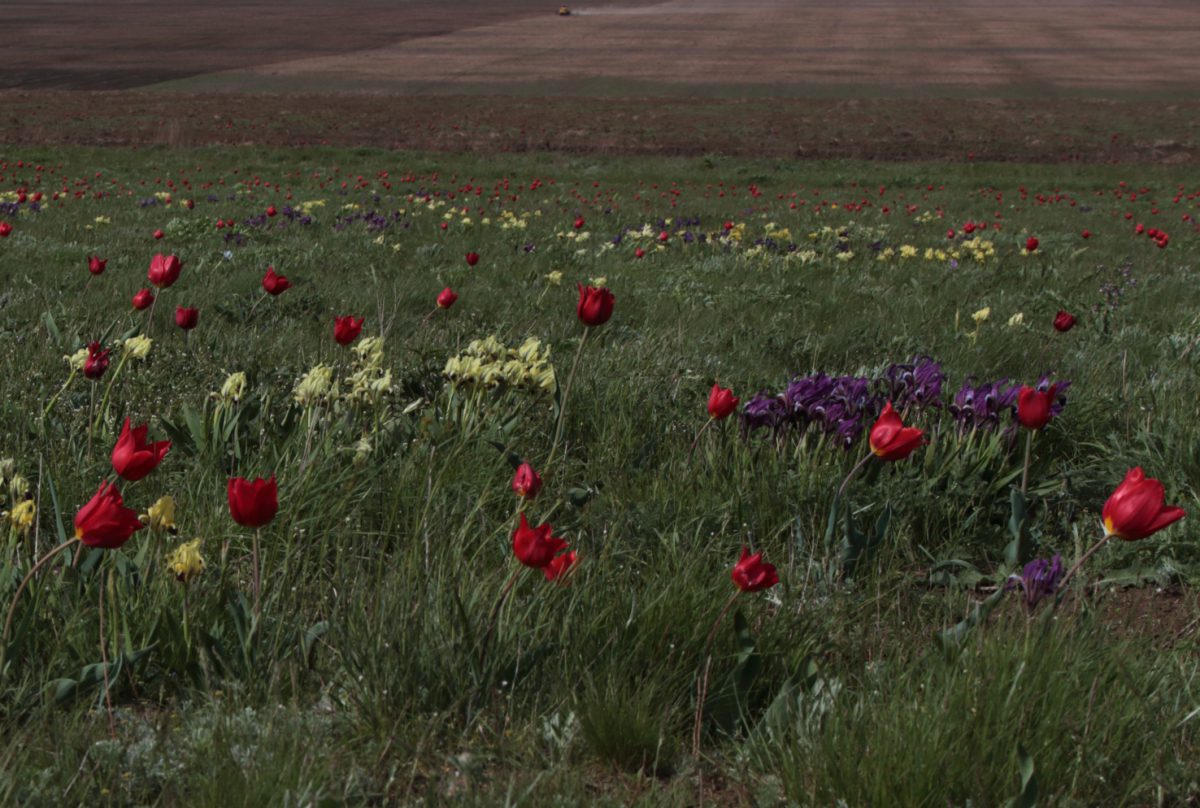
Part of my research is about the level of accuracy we could (or should) achieve when mapping large areas. I have chosen the Eurasian Steppe as a test site because it is vast, large areas of abandonment, as well as permanently used field,) and rich diversity of natural vegetation. At the same time, it is one of the most transformed landscapes in Eurasia where biodiversity conservation and preserving intact steppes as the source of both rare and dominant native species to re-habit the man-made vacuum is a top priority. What makes the mapping of these areas challenging though is that the natural vegetation, mainly grasses and herbs, is spectrally very similarly to agriculture in satellite images.
I am planning to test several mapping techniques taking into account the advantages of each and adjust them to specific conditions of the steppe. The random forest algorithm is easy and fast enough to make initial maps. These maps show general land cover of an area and allow to reveal sources of mismapping. The segmentation algorithm is helpful in drawing more clear borders but fails to distinguish objects that have similar reflection while belonging to different classes. The understanding of general structure gained from the initial maps gives better reasons to divide a large heterogeneous area into smaller and more solid parts where differences between the mapping classes are higher than in-class variability. Ultimately, I hope to achieve two results. The first is understanding of how to combine existing methods to improve the whole map quality. The second is to create maps suitable for ecological research, preserving biodiversity and the establishment of new protected areas.

Over the last century, US agriculture greatly intensified and became industrialized, increasing in inputs and yields while decreasing in total cropland area. In the industrial sector, spatial agglomeration effects are typical, but such changes in the patterns of crop types and diversity would have major implications for the resilience of food systems to global change. Here, we investigate the extent to which agricultural industrialization in the United States was accompanied by agglomeration of crop types, not just overall cropland area, as well as declines in crop diversity. Based on countylevel analyses of individual crop land cover area in the conterminous United States from 1840 to 2017, we found a strong and abrupt spatial concentration of most crop types in very recent years. For 13 of the 18 major crops, the widespread belts that characterized early 20th century US agriculture have collapsed, with spatial concentration increasing 15-fold after 2002. The number of counties producing each crop declined from 1940 to 2017 by up to 97%, and their total area declined by up to 98%, despite increasing total production. Concomitantly, the diversity of crop types within counties plummeted: in 1940, 88% of counties grew >10 crops, but only 2% did so in 2017, and combinations of crop types that once characterized entire agricultural regions are lost. Importantly, declining crop diversity with increasing cropland area is a recent phenomenon, suggesting that corresponding environmental effects in agriculturally dominated counties have fundamentally changed. For example, the spatial concentration of agriculture has important consequences for the spread of crop pests, agrochemical use, and climate change. Ultimately, the recent collapse of most agricultural belts and the loss of crop diversity suggest greater vulnerability of US food systems to environmental and economic change, but the spatial concentration of agriculture may also offer environmental benefits in areas that are no longer farmed.
File: gcb.15396.pdf
After 1991, major events, such as the collapse of socialism and the transition to market economies, caused land use change across the former USSR and affected forests in particular. However, major land use changes may have occurred already during Soviet rule, but those are largely unknown and difficult to map for large areas because 30-m Landsat data is not available prior to the 1980s. Our goal was to analyze the rates and determinants of forest cover change from 1967 to 2015 along the Latvian-Russian border, and to develop an object-based image analysis approach to compare forest cover based on declassified Corona spy satellite images from 1967 with that derived from Landsat 5 TM and Landsat 8 OLI images from 1989/1990 and 2014/2015. We applied Structurefrom- Motion photogrammetry to orthorectify and mosaic the scanned Corona images, and extracted forest cover from Corona and Landsat mosaics using object-based image analysis in eCognition and expert classification. In a sensitivity analysis, we tested how the scale parameters for the segmentation affected the accuracy of the change maps. We analyzed forest cover and forest patterns for our full study area of 22,209 km2, and applied propensity score matching approach to identify three Latvian-Russian pairs of 15 × 15 km cells, which we compared. We attained overall classification accuracies of 92% (Latvia) and 93% (Russia) for the forest/non-forest change maps of 1967–1989, and 91% (Latvia) and 93% (Russia) for 1989–2015, and our results were robust in regards to the segmentation scale parameter. Sample-based forest cover gain from 1967 to 1989 differed notably between the two countries (18.5% in Latvia and 23.6% in Russia), but was generally much higher prior to 1989 than from 1989 to 2015 (8.7% in Latvia and 9.7% in Russia). Furthermore, we found rapid de-fragmentation of forest cover, where forest core area increased, and proportions of isolated patches and forest corridors decreased, and this was particularly pronounced in Russia. Our findings highlight the need to study Soviet-time land cover and land use change, because rural population declines and major policy decisions such as the collectivization of agricultural production, merging of farmlands and agricultural mechanization led already during Soviet rule to widespread abandonment and afforestation of remote farmlands. After 1991, government subsidies for farming declined rapidly in both countries, but in Latvia, new financial aid from the EU became available after 2001. In contrast, remoteness, lower population density, and less of a legacy of intensive cultivation resulted in higher rates of forest gain in Russia. Including Corona imagery in our object-based image analysis workflow allowed us to examine half a century of forest cover changes, and that resulted in surprising findings, most notably that forest area gains on abandoned farm fields were already widespread during the Soviet era and not just a postsocialist land use change trend as had been previously reported.
File: 1-s2.0-S0034425720303801-main.pdf
European Russia rapidly transitioned after the collapse of the Soviet Union from state socialism to a market economy. How did this political and economic transformation interact with ecological conditions to determine forest loss and gain? We explore this question with a study of European Russia in the two decades following the collapse of the Soviet Union. We identify three sets of potential determinants of forest-cover change—supply-side (environmental), demand-side (economic), and political/administrative factors. Using new satellite data for three distinct types of forest-cover change—logging, forest fires, and forest gain—we quantify the relative importance of these variables in province-level regression models during periods of a) state collapse (1990s), and b) state growth (2000s). The three sets of covariates jointly explain considerable variation in the outcomes we examine, with size of forest bureaucracy, autonomous status of the region, and prevalence of evergreen forests emerging as robust predictors of forest-cover change. Overall, economic and administrative variables are significantly associated with rates of logging and reforestation, while environmental variables have high explanatory power for patterns of forest fire loss.
File: 1-s2.0-S0264837719312153-main.pdf
Cropland abandonment is a widespread land-use change, but it is difficult to monitor with remote sensing because it is often spatially dispersed, easily confused with spectrally similar land-use classes such as grasslands and fallow fields, and because post-agricultural succession can take different forms in different biomes. Due to these difficulties, prior assessments of cropland abandonment have largely been limited in resolution, extent, or both. However, cropland abandonment has wide-reaching consequences for the environment, food production, and rural livelihoods, which is why new approaches to monitor long-term cropland abandonment in different biomes accurately are needed. Our goals were to 1) develop a new approach to map the extent and the timing of abandoned cropland using the entire Landsat time series, and 2) test this approach in 14 study regions across the globe that capture a wide range of environmental conditions as well as the three major causes of abandonment, i.e., social, economic, and environmental factors. Our approach was based on annual maps of active cropland and non-cropland areas using Landsat summary metrics for each year from 1987 to 2017. We streamlined perpixel classifications by generating multi-year training data that can be used for annual classification. Based on the annual classifications, we analyzed land-use trajectories of each pixel in order to distinguish abandoned cropland, stable cropland, non-cropland, and fallow fields. In most study regions, our new approach separated abandoned cropland accurately from stable cropland and other classes. The classification accuracy for abandonment was highest in regions with industrialized agriculture (area-adjusted F1 score for Mato Grosso in Brazil: 0.8; Volgograd in Russia: 0.6), and drylands (e.g., Shaanxi in China, Nebraska in the U.S.: 0.5) where fields were large or spectrally distinct from non-cropland. Abandonment of subsistence agriculture with small field sizes (e.g., Nepal: 0.1) or highly variable climate (e.g., Sardinia in Italy: 0.2) was not accurately mapped. Cropland abandonment occurred in all study regions but was especially prominent in developing countries and formerly socialist states. In summary, we present here an approach for monitoring cropland abandonment with Landsat imagery, which can be applied across diverse biomes and may thereby improve the understanding of the drivers and consequences of this important land-use change process.
File: 1-s2.0-S0034425720302431-main.pdf