Spatial Analysis For Conservation and Sustainability
Biodiversity
Species richness varies by orders of magnitude across the globe and so does the richness of endangered species. We are interested in both the macroecological processes causing richness patterns, and the socioeconomic processes determining where biodiversity is threatened.
The positive monotonic relationship between habitat heterogeneity and species richness is a cornerstone of ecology. Recently, it was suggested that this relationship should be unimodal rather than monotonic due to a tradeoff between environmental heterogeneity and population sizes, which increases local species extinctions at high heterogeneity levels. Here, we studied the richness–heterogeneity relationship for an avian community using two different environmental variables, foliage-height diversity and cover type diversity. We analyzed the richness–heterogeneity within different habitat types (grasslands, savannas, or woodlands) and at the landscape scale. We found strong evidence that both positive and unimodal relationships exist at the landscape scale. Within habitats we found positive relationships between richness and heterogeneity in grasslands and woodlands, and unimodal relationships in savannas. We suggest that the length of the environmental heterogeneity gradient (which is affected by both spatial scale and the environmental variable being analyzed) affects the type of the richness–heterogeneity relationship. We conclude that the type of the relationship between species richness and environmental heterogeneity is non-ubiquitous, and varies both within and among habitats and environmental variables.
In the past decade, concern for forest loss has spurred ambitious restoration goals for climatic, ecological, and livelihood benefits. Restoration activities typically rely on government-led or large-scale tree planting. A narrow focus on top-down initiatives could promote the recentralization of forestry activities and overlook important contributions by smallholders, especially in Africa. Smallholder tree planting activities are harder to track than institutional efforts. Here we quantify the extent of tree planting on smallholder woodlots in southern and eastern Tanzania, in comparison to large-scale plantations. In Google Earth Pro, we digitized all woodlots in randomly selected areas, and estimated woodlots' area, distribution, and expansion rate. We found that by year 2018, woodlots in the smallest size class (< 1 Ha) made up about half of the overall tree planting extent, covering an area equivalent to the government and corporate plantations. What's more, smallholder woodlots have been planted more recently: 54% of the digitized samples were planted between 2012 and 2015, a sign of woodlots' rising prominence. The vast majority of all planted trees were non-native pine and eucalyptus. Thus far, Tanzanian smallholders are planting trees in response to regional timber demand. Subsidies or incentives linked to global restoration goals could encourage more diverse planting and longer harvesting cycles. Given African countries' recent massive restoration pledges (e.g., Tanzania's 5.2 M Ha), we recommend explicit incorporation of smallholder tree planting to maximize livelihood and governance benefits.
Biodiversity science and conservation alike require environmental indicators to understand species richness and predict species distribution patterns. The Dynamic Habitat Indices (DHIs) are a set of three indices that summarize annual productivity measures from satellite data for biodiversity applications, and include: a) cumulative annual productivity; b) minimum annual productivity; and c) variation in annual productivity. At global scales and in temperate regions the DHIs predict species diversity patterns well, but the DHIs have not been tested in the tropics, where higher levels of productivity lead to the saturation of many remotely sensed vegetation indices. Our goal was to explain bird species richness patterns based on the DHIs in tropical areas. We related the DHIs to species richness of resident landbirds for five guilds (forest, scrub, grassland, generalist, and all resident birds) based on a) species distribution model (SDM) maps for 217 species, and b) range map for 564 species across Thailand. We also quantified the relative importance of the DHIs in multiple regression models that included two measures of topography, and two climate metrics using multiple regression, best-subsets, and hierarchical partitioning analyses. We found that the three DHIs alone explained forest bird richness best (R2adj 0.61 for both SDM- and rangemap based richness; 0.15–0.54 for the other guilds). When combining the DHIs with topography and climate, the richness of both forest birds and all resident bird species was equally well explained (R2adj 0.85 and 0.67 versus 0.81 and 0.68). Among the three DHIs, cumulative annual productivity had the greatest explanatory power for all guilds based on SDM richness maps (R2adj 0.54–0.61). The strong relationship between the DHIs and bird species richness in Thailand suggests that the DHIs capture energy availability well and are useful in biodiversity assessments and potentially bird conservation in tropical areas.
Biodiversity science and conservation alike require environmental indicators to understand species richness and predict species distribution patterns. The Dynamic Habitat Indices (DHIs) are a set of three indices that summarize annual productivity measures from satellite data for biodiversity applications, and include: a) cumulative annual productivity; b) minimum annual productivity; and c) variation in annual productivity. At global scales and in temperate regions the DHIs predict species diversity patterns well, but the DHIs have not been tested in the tropics, where higher levels of productivity lead to the saturation of many remotely sensed vegetation indices. Our goal was to explain bird species richness patterns based on the DHIs in tropical areas. We related the DHIs to species richness of resident landbirds for five guilds (forest, scrub, grassland, generalist, and all resident birds) based on a) species distribution model (SDM) maps for 217 species, and b) range map for 564 species across Thailand. We also quantified the relative importance of the DHIs in multiple regression models that included two measures of topography, and two climate metrics using multiple regression, best-subsets, and hierarchical partitioning analyses. We found that the three DHIs alone explained forest bird richness best (R2adj 0.61 for both SDM- and rangemap based richness; 0.15–0.54 for the other guilds). When combining the DHIs with topography and climate, the richness of both forest birds and all resident bird species was equally well explained (R2adj 0.85 and 0.67 versus 0.81 and 0.68). Among the three DHIs, cumulative annual productivity had the greatest explanatory power for all guilds based on SDM richness maps (R2adj 0.54–0.61). The strong relationship between the DHIs and bird species richness in Thailand suggests that the DHIs capture energy availability well and are useful in biodiversity assessments and potentially bird conservation in tropical areas.
Identifying the factors that determine habitat suitability and hence patterns of wildlife abundances
over broad spatial scales is important for conservation. Ecosystem productivity is a key aspect of habitat
suitability, especially for large mammals. Our goals were to a) explain patterns of moose (Alces alces)
abundance across Russia based on remotely sensed measures of vegetation productivity using Dynamic
Habitat Indices (DHIs), and b) examine if patterns of moose abundance and productivity difered before
and after the collapse of the Soviet Union. We evaluated the utility of the DHIs using multiple regression
models predicting moose abundance by administrative regions. Univariate models of the individual
DHIs had lower predictive power than all three combined. The three DHIs together with environmental
variables, explained 79% of variation in moose abundance. Interestingly, the predictive power of the
models was highest for the 1980s, and decreased for the two subsequent decades. We speculate that
the lower predictive power of our environmental variables in the later decades may be due to increasing
human infuence on moose densities. Overall, we were able to explain patterns in moose abundance in
Russia well, which can inform wildlife managers on the long-term patterns of habitat use of the species.
Ecotourism is developing rapidly in biodiversity hotspots worldwide, but there is limited and mixed
empirical evidence that ecotourism achieves positive biodiversity outcomes. We assessed whether ecotourism
influenced forest loss rates and trajectories from 2000 to 2017 in Himalayan temperate forests. We compared forest
loss in 15 ecotourism hubs with nonecotourism areas in 4 Himalayan countries. We used matching statistics to
control for local-level determinants of forest loss, for example, population density, market access, and topography.
None of the ecotourism hubs was free of forest loss, and we found limited evidence that forest-loss trajectories in
ecotourism hubs were different from those in nonecotourism areas. In Nepal and Bhutan, differences in forest loss
rates between ecotourism hubs and matched nonecotourism areas did not differ significantly, and the magnitude
of the estimated effect was small. In India, where overall forest loss rates were the lowest of any country in
our analysis, forest loss rates were higher in ecotourism hubs than in matched nonecotourism areas. In contrast,
in China, where overall forest loss rates were highest, forest loss rates were lower in ecotourism hubs than
where there was no ecotourism. Our results suggest that the success of ecotourism as a forest conservation
strategy, as it is currently practiced in the Himalaya, is context dependent. In a region with high deforestation
pressures, ecotourism may be a relatively environmentally friendly form of economic development relative to
other development strategies. However, ecotourism may stimulate forest loss in regions where deforestation rates
are low.
Remotely sensed data can estimate terrestrial productivity more consistently and comprehensively across large
areas than field observations. However, questions remain how species richness and abundances are related to
terrestrial productivity in different biogeographic realms. The Dynamic Habitat Indices (DHIs) are a set of three
remote sensing indices each related to a key biodiversity productivity hypothesis (i.e., available energy proxied by
the annual cumulative productivity, environmental stress proxied by the minimum productivity throughout the
year, and environmental stability proxied by the annual coefficient of variation in productivity). Here, we quantify
the relevance of each hypothesis globally and for different biogeographic realms using models of species richness
for three taxa (amphibians, birds, and mammals) derived from IUCN species range maps. Using parameterized
generalized additive models (GAM’s) we found that the available energy hypothesis was the best individual
index explain 37–43% of the variation in species richness globally with the best models for amphibians and
worst for mammal richness. Examining the residuals of these GAMS indicated that adding the environmental
stress hypothesis explained 0–22% additional variance, especially in the Nearctic where large amounts of snow
and ice are prevalent and environmental conditions deteriorate during winter. The addition of the environmental
stability hypothesis generally explained more variance than the environmental stress hypothesis, especially in
the Neartic and Paleartic and for birds however, in certain cases, the environmental stress hypothesis explains
more variance at the realm scale.
The thermal environment limits species ranges through its influence on physiology and resource distributions
and thus affects species richness patterns over broad spatial scales. Understanding how temperature drives
species richness patterns is particularly important in the context of global change and for effective conservation
planning. Landsat 8's Thermal Infrared Sensor (TIRS) allows direct mapping of temperature at moderate spatial
resolutions (100 m, downscaled by the USGS to 30 m), overcoming limitations inherent in coarse interpolated
weather station data that poorly capture fine-scale temperature patterns over broad areas. TIRS data thus offer
the unique opportunity to understand how the thermal environment influences species richness patterns. Our
aim was to develop and assess the ability of TIRS-based temperature metrics to predict patterns of winter bird
richness across the conterminous United States during winter, a period of marked temperature stress for birds.
We used TIRS data from 2013-2018 to derive metrics of relative temperature and intra-seasonal thermal heterogeneity.
To quantify winter bird richness across the conterminous US, we tabulated the richness only for
resident bird species, i.e., those species that do not move between the winter and breeding seasons, from the
North American Breeding Bird Survey, the most extensive survey of birds in the US. We expected that relative
temperature and thermal heterogeneity would have strong positive associations with winter bird richness because
colder temperatures heighten temperature stress for birds, and thermal heterogeneity is a proxy for
thermal niches and potential thermal refugia that can support more species. We further expected that both the
strength of the effects and the relative importance of these variables would be greater for species with greater
climate sensitivity, such as small-bodied species and climate-threatened species (i.e., those with large discrepancies
between their current and future distributions following projected climate change). Consistent with
our predictions, relative temperature and thermal heterogeneity strongly positively influenced winter bird
richness patterns, with statistical models explaining 37.3% of the variance in resident bird richness. Thermal
heterogeneity was the strongest predictor of small-bodied and climate-threatened species in our models, whereas
relative temperature was the strongest predictor of large-bodied and climate-stable species. Our results demonstrate
the important role that the thermal environment plays in governing winter bird richness patterns and
highlight the previously underappreciated role that intra-seasonal thermal heterogeneity may have in supporting
high winter bird species richness. Our findings thus illustrate the exciting potential for TIRS data to guide
conservation planning in an era of global change.
Habitat loss is the primary driver of biodiversity decline worldwide, but the effects of fragmentation (the spatial
arrangement of remaining habitat) are debated. We tested the hypothesis that forest fragmentation sensitivity—
affected by avoidance of habitat edges—should be driven by historical exposure to, and therefore species’
evolutionary responses to disturbance. Using a database containing 73 datasets collected worldwide (encompassing
4489 animal species), we found that the proportion of fragmentation-sensitive species was nearly three times
as high in regions with low rates of historical disturbance compared with regions with high rates of disturbance
(i.e., fires, glaciation, hurricanes, and deforestation). These disturbances coincide with a latitudinal gradient
in which sensitivity increases sixfold at low versus high latitudes. We conclude that conservation efforts to limit
edges created by fragmentation will be most important in the world’s tropical forests.
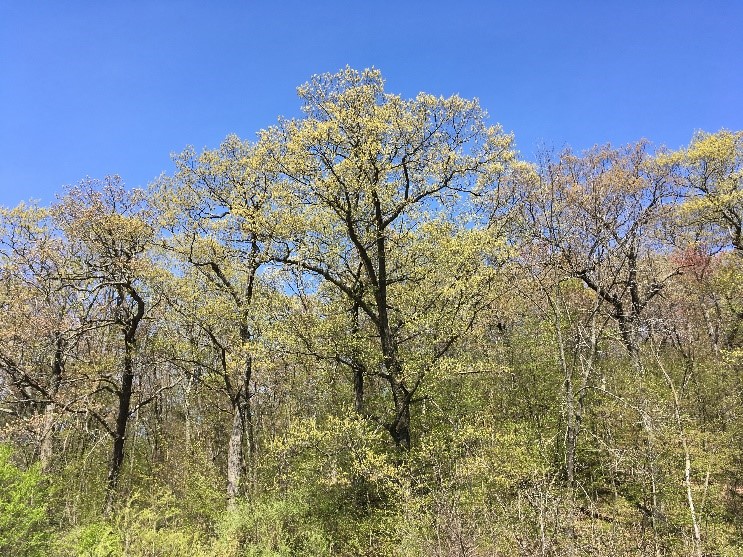
While walking through a forest in spring we often marvel at the vivid greenness, listen to birdsong, and mind our steps in order not to get into a spider’s web. Enjoying the moment, we usually do not think about the complexity of this environment, nor the intertwined relations among all of its elements. However, what slips our attention is not going unrecognized by Maia Persche – a Master’s candidate in the SILVIS lab. In her research, Maia seeks to discern the role of topography in the timing of vegetation growth onset within forest, and to understand how topographic position potentially shapes songbird habitat.
Spring leaf emergence on a hillside in Baxter’s Hollow
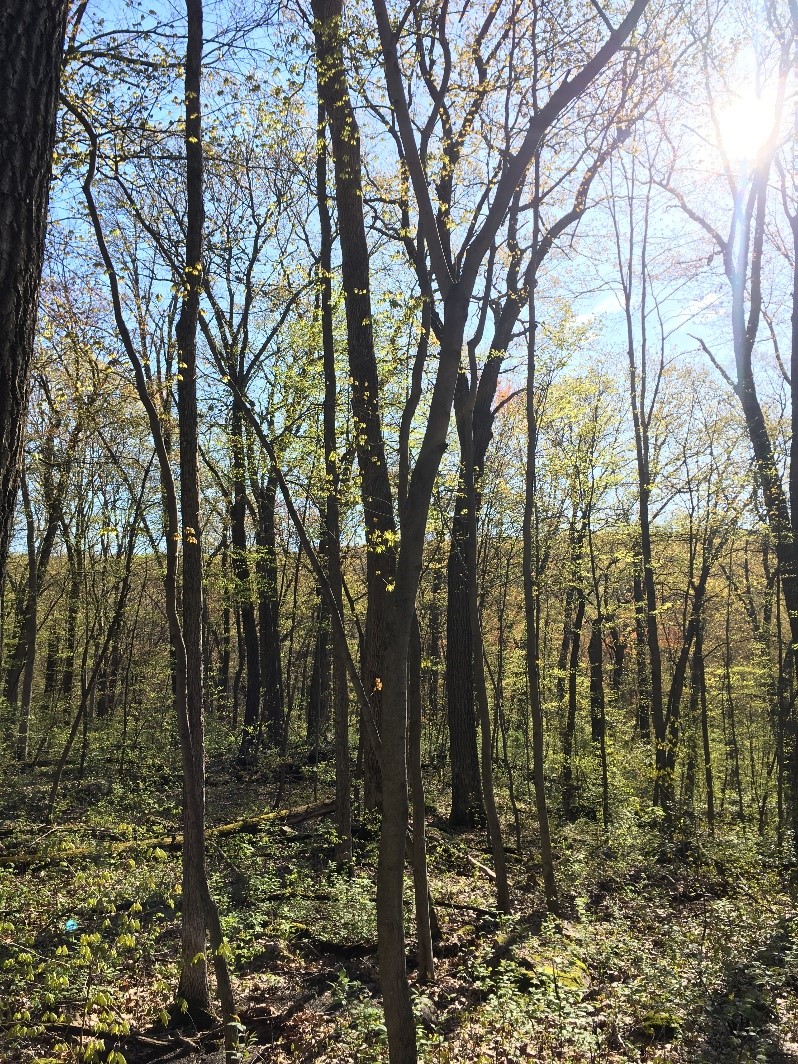
To gain insight into these questions, Maia undertook the challenging tasks of measuring tree phenology, and conducting invertebrate and bird surveys in her study area in the Baraboo Hills of Southern Wisconsin. In order to relate these data to each other, each type of survey was carried out at the same 70 locations during narrow time windows throughout the season. Tree phenology surveys occurred in April and May, and invertebrate and bird surveys were repeated throughout the bird breeding season, or until the end of July. At each location, additional data was collected on temperature, tree species composition, and site characteristics. Over the course of two field seasons, she detected 53 insectivorous bird species, and tracked the seasonal abundance of common invertebrate orders (Lepidoptera, Araneae, Hemiptera, Hymenoptera, Diptera and Coleoptera).
Early May at an upland study site in Devil’s Lake State Park
Based on only a portion of measurements collected, Maia has already drawn some interesting preliminary conclusions. Trees leafed out slightly later in stream gorges than in uplands, and although invertebrate biomass was related to tree phenology, it did not appear to follow a predictable yearly pattern. However, sheltered stream gorges supporteded high invertebrate biomass during the mid- and late summer. This could be important for double-brooded bird species that still have active nests in July and can be limited by food availability in some habitats. Overall, stream gorges supported the highest bird species richness, perhaps due to stable food resources or habitat complexity. Also, a strong association has become evident between particular tree species and invertebrate orders, suggesting that tree composition may be more important than topographic context for some folivorous invertebrates.
Louisiana Waterthrush banded at Baxter’s Hollow
Under shifting climate conditions in deciduous forests, it is important to identify areas where habitat quality for species is likely to remain high. To assess bird territory quality in different topographic situations, Maia used feather growth bar analysis for a few widely distributed forest species (Wood Thrush, Red-eyed Vireo, and Ovenbird). She captured birds throughout her study area using mist nets, playback calls, and bird models. She then banded the birds, took structural measurements, and pulled one tail feather. Growth bars, or horizontal bands along the feather, correspond to diet richness of the bird while the feather was growing, and will be used to assess social dominance and habitat quality. Although this approach provides a detailed look at habitat quality, it is also the most difficult to carry out in the field.
Maia has collected a large amount of data, and analyzing the relationships among different factors and trophic levels is somewhat daunting, but she approaches it with great enthusiasm. Maia is currently working to determine how bird territory density varies according to topographic context. It is definitively worth staying tuned to see what new results Maia uncovers!