Posted 01/17/13
As land-change science evolves, more disciplines use change products to inform management decisions and to test scientific hypotheses. Analyses that lack understanding of the cause of landcover change may lead to false conclusions and poor management practices. Matthias's work focuses on developing techniques to correctly classify disturbance processes from satellite imagery of the temperate forest region of European Russia to provide more accurate information to researchers that use his maps.
A picture may be worth 1000 words, but when they’re used to make policy decisions, or to explain ecological phenomena, they need to tell a consistent story. Matthias Baumann’s work in the temperate forest zone of European Russia attempts to push the boundaries of land-use/land-cover change detection by focusing on disturbance processes through spectral and pattern recognition. ‘Ultimately we want remote sensing to produce useful maps’ says Matthias. Ecologists may use maps of landcover change to determine how carbon budgets change over time, whereas economists may use the same data to determine the extent and value of year-to-year timber stock. In both of these cases simply knowing that landcover has changed only gets the end-user so far. For instance, when economists consider all disturbances anthropogenic this may influence the results of an analysis to determine the best predictors of timber harvest (such as proximity to roads, or population density). Such results may then lead to changes in timber harvest policy. This trickle-down effect may result in suboptimal timber practices simply due to a lack of information in the map. Matthias’s goal then, has been to develop techniques to further classify disturbance causes, which can be readily built upon established spatial analysis processing chains. In his most recent research he has developed a decision-making algorithm to differentiate between human-caused deforestation (i.e. timber harvest) and natural disturbance events such as windfall. This algorithm uses a linear transformation of tassel-cap components and thresholding to separate the two causes of disturbance. Through cross-validation, Matthias has demonstrated his method to be 80% accurate in choosing between timber harvest and windfall.
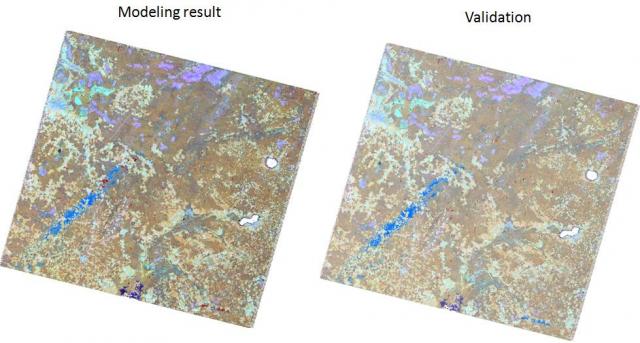
When economists attempt to model the relationships between timber harvest and socio-economic variables without distinguishing between causes of disturbance they increase the probability they will ascribe causation to the wrong parameter. When Baumann and colleagues inputted their new classified maps into these economic models they found little change in the overall results, although the inclusion of antropogenic vs. natural disturbance classes did change the significance of several explanatory variables. Distance to roads, for instance, became a much better predictor of timber harvest once natural disturbance was accounted for, presumably because those areas of severe wind damage were farther out in the countryside while most harvesting took place near pathways of transportation.
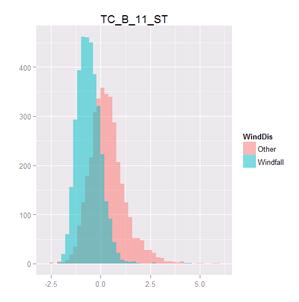
The algorithm is not perfect, though. In cases such as tornadoes, where trees are both blown down and removed from the site, the models have a difficult time ascribing the correct cause since the algorithm is based primarily on the proportion of exposed bare soil. Matthias is currently working to improve model accuracy using both the spectral signature used now, and a measure of disturbance spatial structure. Since timber harvests tend to be geometric in shape the inclusion of this information in the decision making process should increase model accuracy overall.”
Story by David La Puma