Posted 02/25/13
Monitoring of biodiversity is one of the keystones of conservation biology. However, traditional ways of species biodiversity estimation are time- and labor-consuming. At the same time, avian abundance and richness is correlated with some parameters of habitat structure, which one can estimate by satellite images. Using remote sensing for habitat structure analysis, Patrick explained 70% of the variation in forest bird species richness. Magnitude of this research is unique, because his is the first such research project that was made nationwide. The analysis resulted in the map of bird diversity for the whole United States.
Where are biodiversity hotspots located? How should we allocate conservation money? Which species or areas are more important than others? What should we our conservation priorities? To answer such questions, we need to estimate biodiversity, but that is easier said than done. For example, estimation of bird species richness or bird abundance requires a lot of field work to survey birds following by statistical analysis. If we need to make a nationwide map of avian diversity, this goal becomes even less feasible. This is why Patrick Culbert worked hard to predict avian diversity using remote sensing. He analyzed habitat structure measures which can be obtained from satellite images. The nice feature of this analysis is its objectivity: we do not need to deal with habitat descriptions made by different researchers in different areas of the country. However, having this remotely sensed data in hand, the question is how to connect these data with birds? Fortunately, the Breeding Bird Survey, large archive of bird data is available due to many volunteers collecting data every year. During Breeding Bird Survey season, volunteers follow transects of 24.5 miles, making stops every 0.5 of miles, 50 stops in total. At each stop they write down all birds they see or hear within a 3 minute window. Since the Breeding Bird Survey started in 1966, this means that a huge archive of data collected for the whole US is available for analysis. Patrick’s study made use of 2,546 Breeding Bird Survey routes.
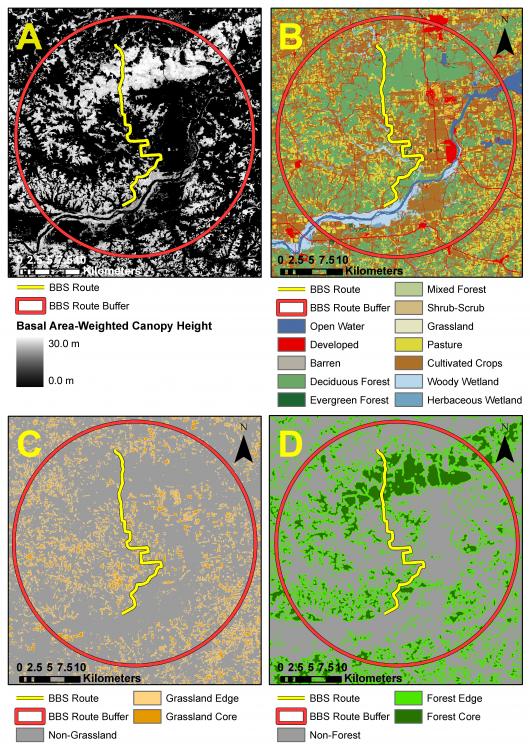
Patrick analyzed habitat structure of the buffer zone around BBS routes. He separated some land use classes to calculate percentage each of them: agriculture, deciduous and evergreen forest, shrubs, barren and so on. Some classes, for example forest and grassland also was separated into core and edge forest and grassland, respectively. Then he analyzed bird richness for every land use class. Patrick used some measures describing vertical and horizontal habitat structure. Both vertical and horizontal habitat structure was important predictors to explain avian diversity, but canopy height and above ground biomass was better than others. In particular, Patrick looked at forest height using a map made by Josef Kellndorfer (Woodshole Research Center). It turned out that standard deviation of tree height was a particular good predictor of bird species richness. In total, the combination of horizontal and vertical measures of structure explained 70% of the variation in forest bird species richness nationwide, and 48% of the nationwide variation in grassland bird species richness.In general, forested areas had richer avian diversity. Given that most of US forest is located to the east from Mississippi, eastern part of the country is more diverse in terms of birds. Mountainous areas along west coast exhibit a lot of bird species, too. Attempts to predict biodiversity with remote sensing data was made before, but it is the first study which resulted in successful nationwide prediction of avian biodiversity.
Story by Bragina, Eugenia