Posted 12/13/18
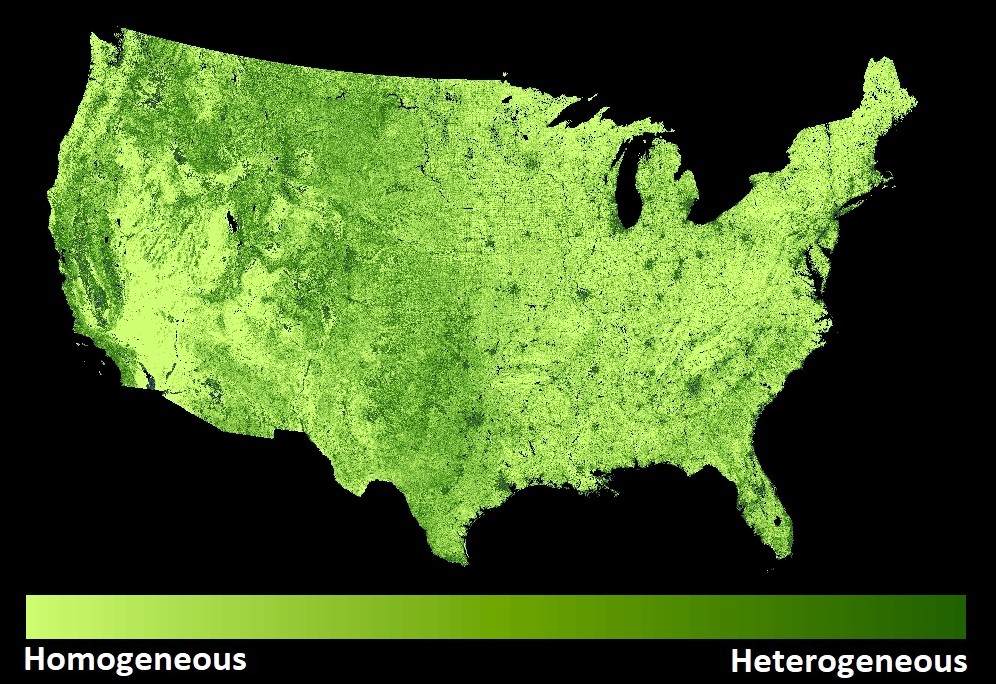
Image texture characterizes habitat heterogeneity, and is a strong predictor of avian species richness and habitat suitability. Dr. Laura S. Farwell is working to develop a set of 16 new texture variables from Landsat imagery capturing spatial heterogeneity of habitat at 30 m resolution, a significant advancement from coarse-scale landscape indices that ignore heterogeneity within habitat types. The texture measures Laura derives will be applied in the development of detailed maps of avian biodiversity across the conterminous U.S.
Humans are rapidly transforming the Earth’s ecosystems, with profound consequences for biodiversity. To predict how species will respond to rapidly changing environments, biodiversity science needs better datasets of biodiversity patterns and species distribution. Dr. Laura Farwell is part of a team on a mission to advance and broaden the use of Landsat satellite data for biodiversity science by characterizing habitat heterogeneity at a medium resolution (30 m), across the conterminous U.S.
Ecological processes influence patterns of species diversity at multiple scales, and landscape grain strongly affects habitat niches and thus biodiversity potential. Vertebrate species in particular tend to select habitat based on parameters acting at multiple scales. For example, several bird species might strongly prefer large patches of primary forests at broader scales, but at a finer scale habitat selection might be strongly influenced by the amount of heterogeneity within habitat patches. Habitat heterogeneity can also influence species diversity patterns as a result of specialization by certain species on different habitat types. And in general, high heterogeneity increases opportunities for species coexistence. It has been hypothesized that avian diversity is strongly influenced by local scale ecosystem patterns. Vegetation structure is one example of a local scale characteristic that many birds seem to key in on, particularly for nest site selection. But collecting these types of data on the ground is logistically difficult and time consuming. If we can characterize habitat heterogeneity using remotely sensed images, this can potentially be a powerful tool for biodiversity science, allowing rapid classification of vegetation, as well as inference about habitat quality and ecological niches.
A set of indices collectively called image texture holds promise for meeting this need. These indices characterize the amount and pattern of contrast in the tonal values of adjacent pixels, a product of the unique spectral signature of different plant species and combinations within the area covered by the pixels. First-order image texture measures differences in spectral values within a defined neighborhood (e.g., a 3×3 window) surrounding each pixel. More advanced image texture analysis involves 2nd-order texture measures based on a spectral value co-occurrence matrix (GLCM) or local indicators of spatial autocorrelation. It has previously been shown that image texture measures are powerful predictors of avian species richness, in an upper Midwestern U.S. grassland-savanna-woodland system, and in a desert- ecosystem. Building on what has been learned in previous studies, Laura will calculate two 1st-order textures (range and standard deviation), two 2nd-order textures (contrast and angular second moment), plus one local indicator of spatial autocorrelation (the G* statistic).
A strength of Laura’s project is the use of Landsat data at 30 m resolution as the basis of texture measures, as this resolution is relevant to many animal species. Laura will characterize image texture across the entire conterminous U.S. She will calculate texture of two different Landsat products- NDVI (which indicates vegetation greenness) and the SWIR band (which highlights leaf and soil moisture content). She will also calculate texture of the cumulative Dynamic Habitat Index currently being derived by PhD student Elena Razenkova, which characterizes plant productivity.
Story by Guzmán Colón, Diana