Posted 04/1/14
Biodiversity is being lost at an alarming rate, often due to habitat degradation and loss. To optimize conservation efforts, planners need a simple way to measure biodiversity over large spatial scales. Filling this need, Naparat Suttidate has shown that biodiversity patterns in Thailand can be predicted based solely on remote sensing data.
Biodiversity is important for ecosystem function and services, but it is being lost at an alarming rate often due to habitat loss or degradation. To better protect remaining biodiversity, conservation planners need a method for monitoring biodiversity over large areas. Naparat Suttidate is working on this task for her homeland of Thailand. This is fortunate as Thailand overlaps with two global biodiversity hotspots: Indo-Burma and Sundaland, and is experiencing rapid habitat loss: 53% of the country was forested in 1961, and only 33% remained forested in 2010.Naparat’s idea is to use remote sensing data to measure the biodiversity of terrestrial animals over large spatial scales. Based on MODIS data, she has calculated the Dynamic Habitat Index (DHI) for all of Thailand.
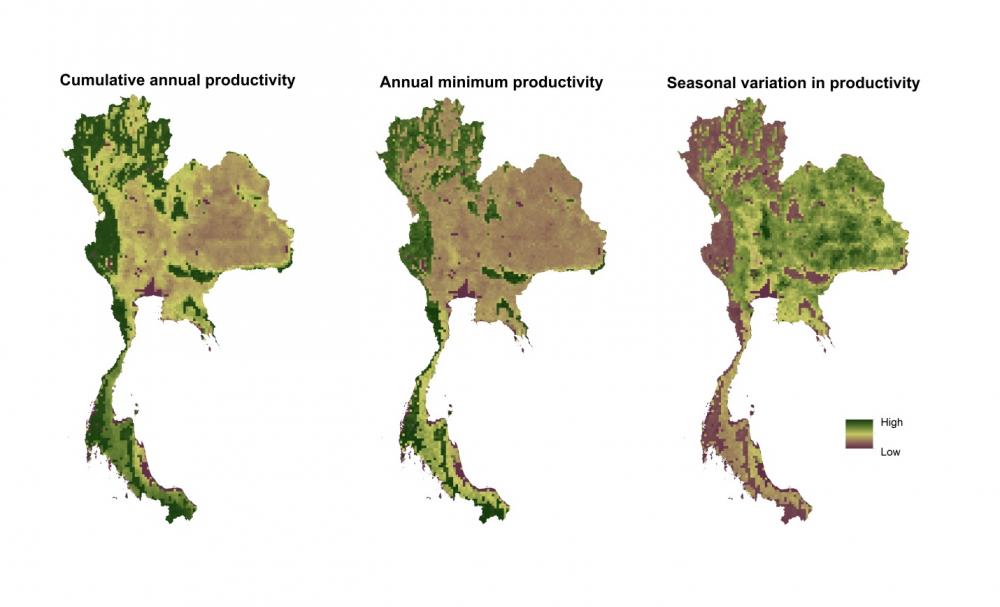
DHI is a measure of vegetative productivity derived from the fraction of absorbed photosynthetically active radiation (fPAR). The DHI summarizes three components of vegetative productivity: The first component is the cumulative annual productivity, providing an indication of overall light absorbed by vegetation. Annual productivity represents the productive capacity of a landscape across a year. If areas have high productivity, they have more energy to support diversity of species. The second component is the annual minimum productivity, providing an indication of the minimal level of vegetative cover to support organisms throughout the year. If the productivity of an area has a high minimum, it should support more biological diversity. The third component is the seasonal variation in productivity, measuring the coefficient of variation in productivity over the course of a year. If any areas have less intra-annual variability, they are more biologically diverse. Then, she correlated the DHI values with biodiversity measures based on IUCN range maps.
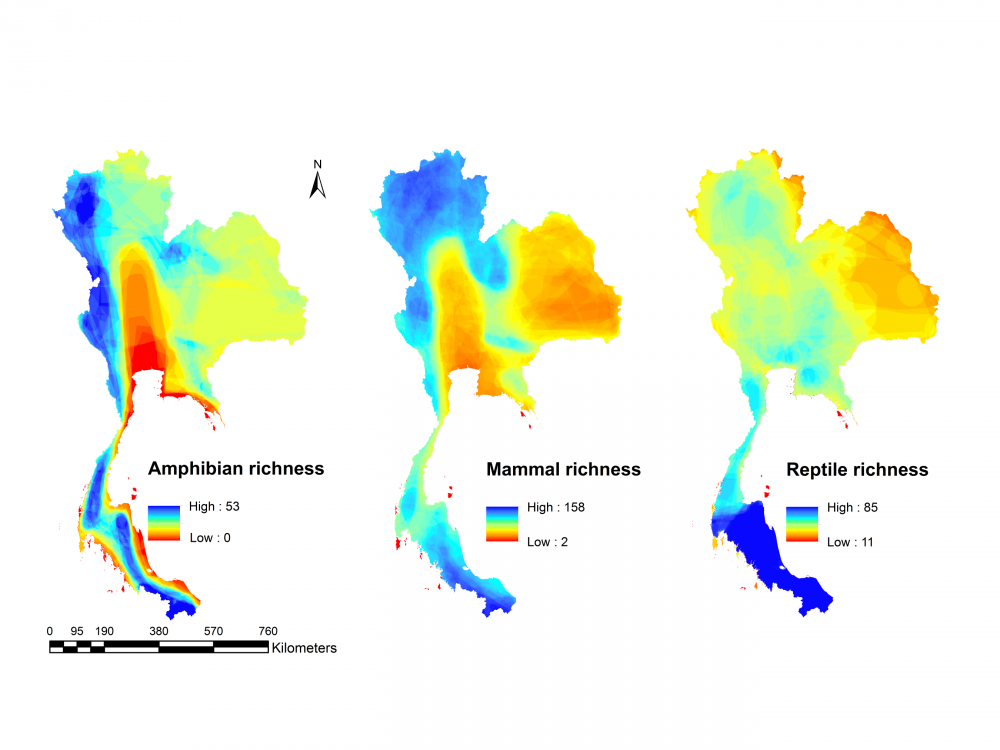
So far, she has found that DHI can predict the species richness of mammals, reptiles, and amphibians in Thailand. Hers is the first study to show that this type of relationship occurs in a tropical region. For now, Naparat’s study locations are randomly sampled from throughout Thailand. However, in the future she would like to focus primarily on forested and protected areas where it will have the largest environmental benefit. Her method to easily measure biodiversity will help conservation planners monitor current protected lands for changes, as well as prioritize new lands for protection, in Thailand and beyond.”
Story by Radeloff, Volker