Posted 09/28/10
Understanding how spatial patterns of vegetation influence the way organisms are distributed across landscapes is a central theme within Landscape Ecology. Post-doc Avi Bar Massada developed Multiscale Contextual Spatial Pattern Analysis (MCSPA), a new method to measure spatial pattern at multiple-scales simultaneously, as an alternative to existing measures. Using bird data from Ft. McCoy, WI, Bar Massada found that MCSPA predicts the variability of species richness better than traditional, single-scale metrics that are commonly used in landscape ecology.
A major component of Landscape Ecology is studying how spatial patterns of vegetation affect ecological processes and individual organisms. A reoccurring issue within the field has always been that the analysis of this process/pattern relationship always depends on the scale of analysis undertaken in the study.
For example, if someone studies the dynamics of forest cover in northern Wisconsin and how it affects the distribution of a particular species, say the Golden-winged Warbler (which depends on Alder thickets and early successional forests), the entire landscape of northern Wisconsin can be divided up into patches of ‘habitat’ and ‘non-habitat’ based on the type of forest. While conducting the analysis of spatial pattern, researchers are constrained by the inherent characteristics of the land cover maps that they use, which among others include grain (pixel size, or the highest level of spatial detail in the map), and extent (the size of the area mapped). A major challenge in these studies is that both of these factors, which are each a component of ‘scale,’ directly affects their results.Many studies that attempt to relate species occurrence to the spatial patterns of landscapes typically have narrowly relevant results, since the spatial pattern is analyzed at a single spatial scale. The scale of analysis has important ramifications for the conclusions of the study and often the patterns that are described at one spatial scale can be very different at another spatial scale. This issue of scale has long hampered the application of Landscape Ecology analyses because patterns of habitat use for individual organisms can vary widely from broader trends found within, and between, populations. SILVIS post-doc Avi Bar Massada, however, has developed a technique that will allow for multiple spatial scales to be incorporated simultaneously into the analysis to more accurately describe how patterns change across these scales. The hope is that by incorporating multiple scales into analyses of spatial pattern, they will generate more accurate predictions about the distribution or abundance of a particular species within an area.Bar Massada calls this technique Multiscale Contextual Spatial Pattern Analysis (MCSPA) and feels that it addresses two major short-comings of traditional methods of spatial pattern analysis: 1) it incorporates multiple scales into the analysis, thereby giving a spatial context to every pixel in a landscape map, and 2) it addresses the fact that not all habitat/non-habitat patches within a given scale are created equal. Going back to the warbler/early successional forest example, a narrow strip of successional forest protruding from a large patch of the same forest type, and surrounded on most sides by agriculture will have very different use patterns by the birds than the core forest it protrudes from. Traditional analysis methods treat contiguous patches of forest as a single entity, and thus would define all parts of the forest patch as suitable habitat (i.e., the basic level of analysis is the patch, regardless of its shape, and the assumption is that it is internally homogeneous). Using Bar Massada’s MCSPA, however, the surrounding areas of agriculture and wetland would indicate that the narrow strip is less suitable habitat for Golden-winged Warblers, since its spatial context is very different than the one of a large block of succesional forest. Such a prediction fits well with known habitat use patterns of the birds.
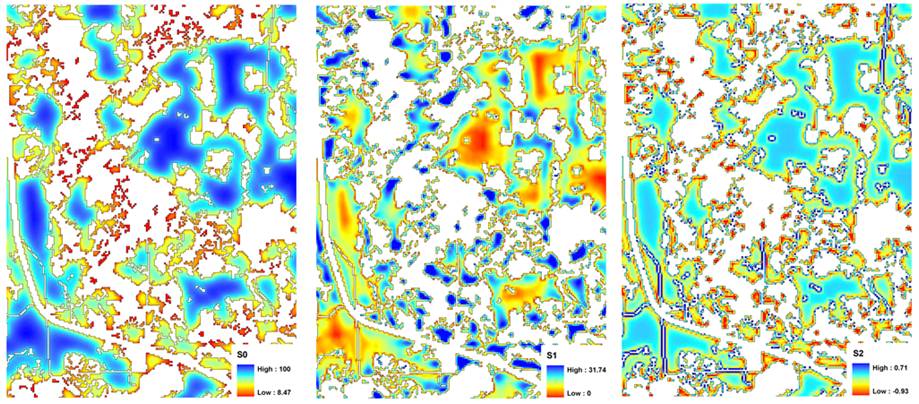
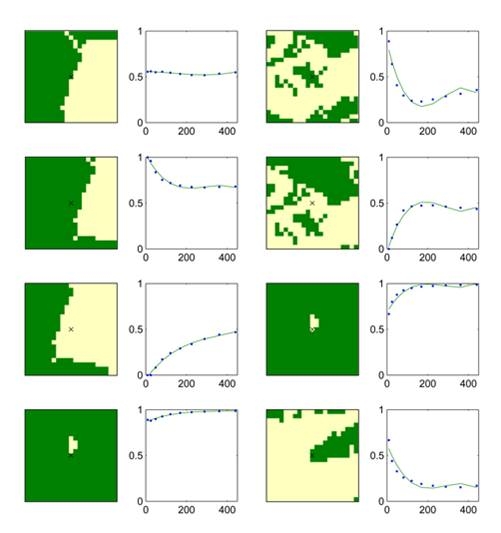
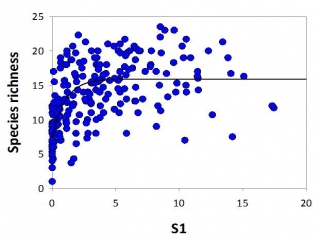
MCSPA works by taking data from multiple spatial scales and using the variability within and between those scales to predict how organisms will respond to the landscape. For any given location within a landscape, the percentage of habitat or non-habitat can change depending on the extent of the surrounding area. Scalograms help represent this change by defining the proportion of habitat at any scale in a functional format. In the warbler example, the thin strip of forest surrounded by agriculture could be represented as a thin strip of habitat surrounded by non-habitat. At the smallest spatial scale, nearly 100% of the area is suitable because the width of the strip is larger than the smallest area of the analysis. As larger portions of the surrounding landscape are iteratively incorporated into the analysis, however, the overall percentage will drop rapidly as areas of non-habitat are brought into the analysis. MCSPA then calculates the mean and standard deviation from these scalograms to quantify multiscale spatial context for each pixel in the landscape map.Bar Massada tested these methods in collaboration with another SILVIS member, Ph. D. candidate Eric Wood, on the distribution an abundance of migrating bird species within Wood’s study site at Fort McCoy, Wisconsin. Ft. McCoy is a patchy landscape with large areas of oak savanna that are important habitat for a variety of migratory songbirds (including the above-mentioned Golden-winged Warbler). Bar Massada applied MCSPA to a habitat map of Ft. McCoy and compared the results to Wood’s field data on species richness and abundance. The MCSPA metrics were correlated with bird species richness and abundance as well as, or better than, existing, single-scale metrics of spatial pattern analysis. The standard deviation of the scalograms explained variability of bird species richness better than single-scale metrics quantifying the percentage of habitat cover, number of patches within a given area, or NDVI (an index that measures the density of healthy green vegetation), all of which have been applied in the past to try and predict species richness.
The application of these techniques could have an important impact on the field of landscape ecology because they analyze a landscape in a fashion similar to how organisms use those landscapes. Birds don’t read maps of habitat vs. non-habitat, and there is no one set scale of focus at which they operate. They can view the landscape as patches from a high vantage point flying overhead as well as select micro-habitats within those patches, all in a very short period of time. For researchers interested in how organisms are influenced by the habitats and the landscapes that surround them, developing tools and techniques to incorporate multiple scales into their analyses is critical to accurately describing species distributions or how those distributions might change through time. Bar Massada’s development of MCSPA is an exciting step in that direction and is definitely on the cutting edge of quantifying how species interact with the spatial patterns of their surrounding environment.”
Story by James Burnham