Posted 01/28/13
Dave Helmers, a GIS/Research Specialist in the SILVIS Lab puts his skills to the test against a huge database of socio-economic data, the U.S. Census. By working his magic on this decadal dataset Dave has developed several unique data products that are being used to answer important ecological questions related to changes in the Wildland-Urban Interface, and housing growth around protected areas. In this interview Dave gives it to me in his own words, as I beg for a little shoulder-work.
Today I’m sitting down with Dave Helmers, a GIS/Research Specialist in the SILVIS lab, to talk about his magic fingers.DL: So when you’re massaging US Census workers, do you use the same technique for everyone? Or are these individual-specific? Swedish or Shiatsu?DH: Ha. I don’t actually massage the workers themselves. What I do massage, though, are the data collected by those workers. I would argue that both are equally in need of a backrub.DL: Oh… I see… so why massage the data?DH: Out of the box, US Census data was not really designed for ecological research, but does provide a wealth of information that can be manipulated to answer ecological questions. Several questions of particular interest to the SILVIS lab have been how to map the Wildland Urban Interface (WUI; pronounced ‘WoooWeee’) across the conterminous US, and whether housing density has changed adjacent to protected lands over time. The census data comes in a database comprised of census blocks, where each block is of a various size and whose boundaries are generally defined by political instead of natural boundaries. Housing information is reported per census block – an administrative boundary with no information on where housing may or may not be distributed in actual space.DL: I see, this is similar to the work I do with weather radar, where I’m using it to study bird migration, an application for which it was never intended. We do some serious data massaging to correct for all sorts of atmospheric issues with the data. Okay, you’ve got my attention, so what exactly do you do with the census data?DH: My first order of business is to identify those areas where houses ‘can’t’ exist. These are areas in the public domain; protected areas, national parks, reserves, etc. I call this the ‘public land adjustment’ (PLA). To do this I overlay a public lands spatial database with the census data to partition each census block into public and private areas. I then reallocate all of the housing numbers to just the private zones of blocks.
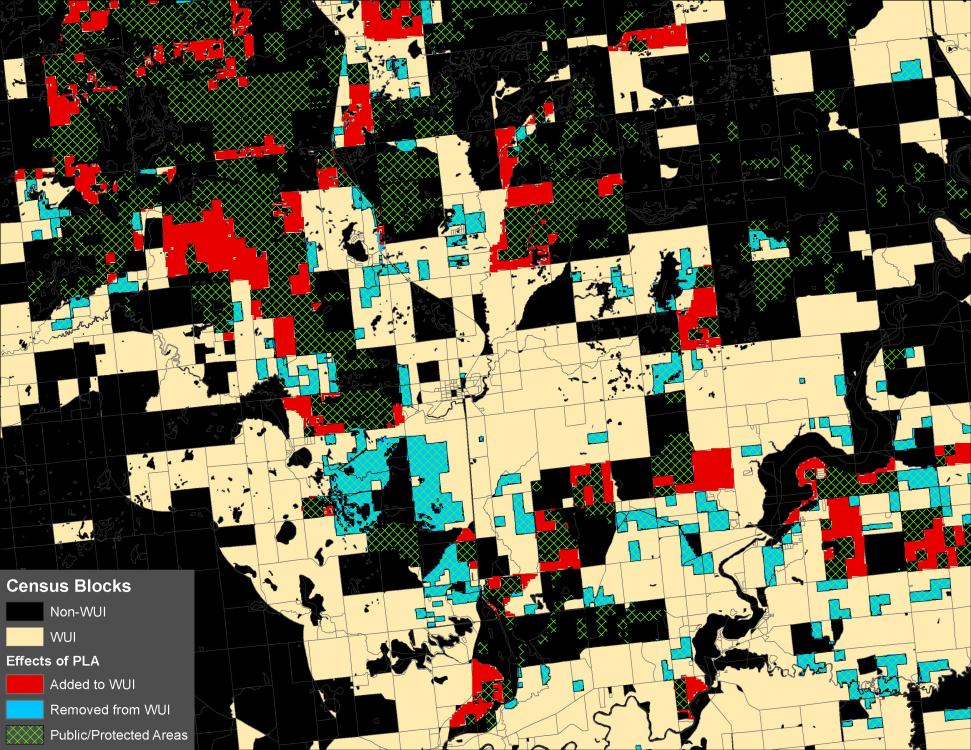
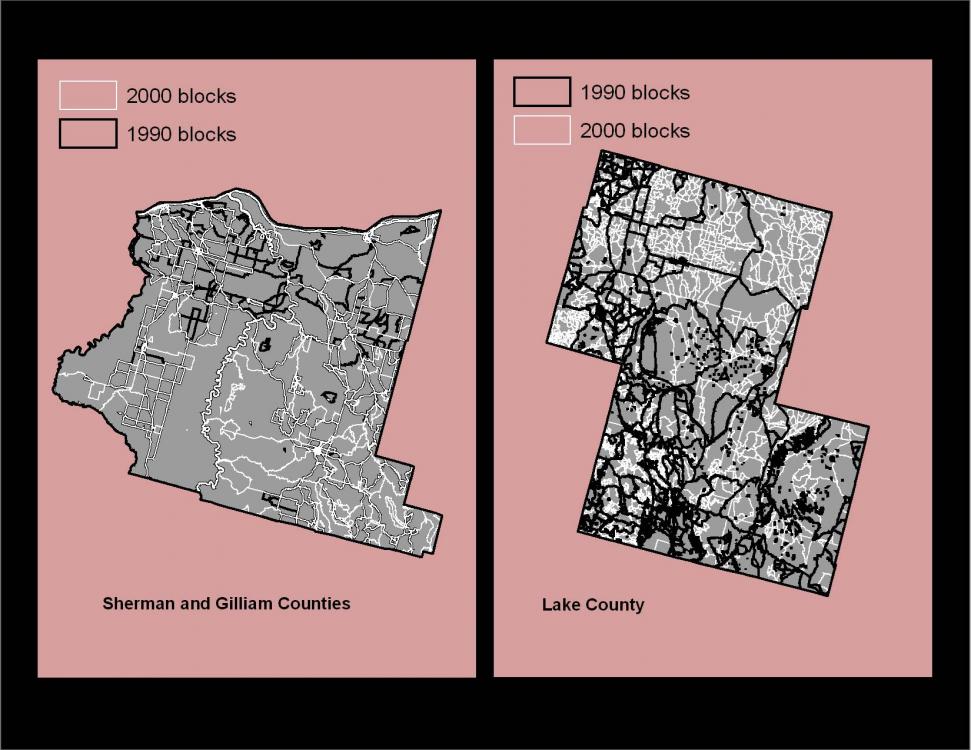
DL: Aha, so this correctly allocates density to the spatial region where houses are allowed, which is important when you’re trying to understand how housing pressures are changing over time, or when defining risks to fires, etc.DH: Exactly. For instance, in the western US, where population density is lower, census blocks are typically much larger and may encompass a large proportion of public lands. Add to this the prevalence of large fires and you start to see the importance of accurate housing density numbers to correctly designate WUI status and to understand the spatial arrangement of high-fire-danger zones. Since the WUI designation is based on housing density (at least 1 housing unit per 40 acres), if we’re going to use census data to map the WUI, we need to have a spatially accurate measure of housing.DL: So is that the only massaging you do to the census data?DH: No, not at all. The other big knot we have to work out, if you will, is the fact that census blocks may change in shape and size from one Census to the next (the US census takes place every 10 years) so even if we know that the raw numbers of houses have gone up or down between periods, we can’t actually say anything about housing density until we account for any spatial changes. To deal with this we overlay the perimeters of three time periods (spanning 30 years) for each census block and map those areas that are shared between them, and those which differ, and compute a time-corrected housing allocation for each resulting polygon. Effectively this allows us to correct for spatial variation in census blocks and make comparisons of housing density across time.
DL: Wow! That sounds like a lot of work, but in the end you’ve got an ecologically relevant product.DH: Yeah, that’s the idea. So the two main questions we’ve been asking with this dataset in the SILVIS lab are ‘how is the WUI changing over time’ and this includes some modeling efforts to predict how it will expand or contract in the future. We’re also asking ‘how does housing density change with respect to protected areas’. Since we see proximity to protected areas as a desirable lifestyle choice, we predict that housing density should increase near these areas. By correctly appropriating the housing numbers to those areas where houses may be built, and by correcting for the changes in census blocks over the years, we have been able to demonstrate that indeed housing around protected areas has increased and that this is having an effect on some guilds of birds. That last bit is from work done by Eric Wood and currently in review.
DL: So are these datasets and products you’re creating for in-house use, or are they available to the public?DH: We serve this data to the public in several forms, ready-to-use maps of housing density and housing density change over time, as well as the geospatial (GIS) data for additional crunching should someone be interested in using it for an analysis. These data area available on our website at the following links:https://russell-silvis.dev.webhosting.cals.wisc.edu/maps/housinghttps://russell-silvis.dev.webhosting.cals.wisc.edu/maps/wuiDL: One last question, so what cool products should we be looking for coming out of the SILVIS massage parlor in the near future?DH: I think the next coolest product will be the WUI change map. Everyone wants to see this, especially the US Forest Service, but the impacts of this dataset will be far-reaching from basic science to management applications, to insurance adjusting. As the U.S. population increase and the old paradigm of having to live near your work degrades, we’re going to see more people living in fire-prone ecosystems. If the climate predictions are accurate, and extreme weather events are going to increase, this type of data is going to be super relevant.DL: It sounds like your masseuse skills are being put to good use. Thanks for taking the time to talk, now if you would, I’ve got this knot on the right side here…”
Story by David La Puma