Posted 01/28/10
Chain Classification is a new methodology to map landcover for large areas. The basic idea is to extrapolate the information obtained in one classified image (first) to classify an adjacent image (second). Reliable training sites for the landcover types to be classified in the second image are obtained from the area of overlay between the two, once this area is already classified in the first image. A third image can be classified based on the second, and so on, resulting in a Chain classification. The methodology is very useful in inaccessible regions were accurate ground data are hard to obtain, and has been successfully implemented in the Carpathian Mountains.
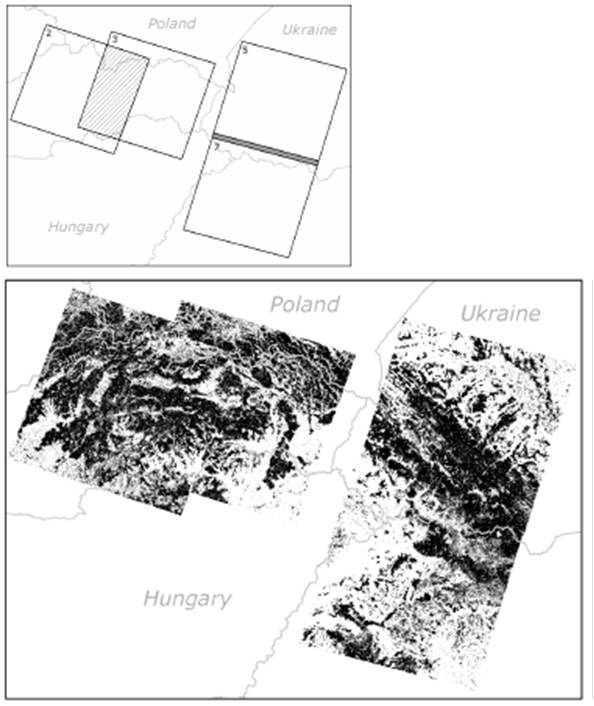
A fundamental piece of information for research in landscape ecology, regional analysis and natural resources management is the availability of detailed and updated large scale vegetation maps. Satellite images have been the major data source to develop such maps, but producing maps for large areas has been sometime problematic. Major constraints include radiometric and atmospheric differences among images, and lack of good training and validation data for large areas due to limits in either accessibility or budget.Cooperation between the Geomatics Lab of the Geography Department of Humboldt University (Berlin) and the SILVIS Lab has resulted in a new promising classification method that could help overcome previous mapping limitations, i.e., ‘chain classification’. The basic idea behind chain classification is that a series of spatial contiguous images (the images chain), can be classified extrapolating the information obtained from the classification of an initial image to classify the neighboring image.With chain classification, a single image of the series (usually one for which good ground information is available) is first classified. Neighboring satellite images share an area on their sides that is covered by both images, so after the first classification is obtained, reliable information on landcover is produced for the overlapping area. Good training sites are then obtained from the overlapping area to classify the second image. The classification of the second image can in turn be used to classify an overlapping third image, and so on, in a ‘classification chain’.
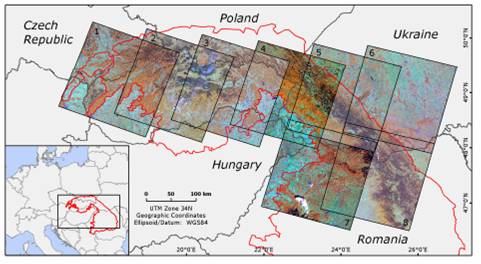
The method has been recently successfully tested in the Carpathian Mountains. Using 8 Landsat images from 2000, 2001 and 2002, colleagues from the Geomatics Lab and the SILVIS Lab developed the method and obtained a map of forested/non-forested areas for most of the Carpathian Mountains range, including parts of Czech Republic, Poland, Ukraine, Hungary and Romania (Knorn et al. 2009). The same set of 8 images was classified first using a classic approach (classifying each image independently with its own set of ground truthing points, approach that requires gathering a large amount of ground information for each image) and second several different chain classification combinations. The typical approach I which each image is classified individually produced excellent results, with accuracies between 92 and 99%. However, Classification Chain produced images with an accuracy loss of just 2 to 5% compared to the classic approach.The results of the Carpathian analysis are very promising, since the chain classification produced excellent results compared to the classic approach, but needed much less ground data , and this makes classifications much faster and cheaper, and allows to classify areas where ground data acquisition is very limited or impossible.Chain classification is a very flexible method, because it can be used with any type of satellite imagery with sufficient spectral resolution and because any classification method can be applied. For example, for the Carpathians a Support Vector Machine classifier was used, a non-parametric classifier that often leads to better results than parametric methods like Maximum Likelihood. Since each image is classified individually, no atmospheric or radiometric corrections are needed. Also, results showed that even a small degree of overlay among neighboring images suffices to have excellent results. However, in order for chain classification to produce the best results, the landcover types should be homogeneous along the region analyzed (i.e., there should be no substantial differences in the land cover types found in each image).In summary, chain classification is a promising tool to classify satellite images and obtain landcover map for large regions, especially in areas where ground data are not available, and when quick reliable results are needed and budget is limited. Being a simple, robust and flexible method, chain classification can provide solutions for scientist and managers with urgent needs to study and manage remote and large areas.
The project was developed with support by the Humboldt-University Berlin and by the NASA Land Cover and Land Use Change Program.”
Story by Gregory Gavier Pizarro