Posted 01/16/14
Weather has been changing rapidly in the past decades, including stronger and more frequent extreme events that affect both humans and wildlife. Jessica Gorzo is analyzing MODIS satellite data from 2003-2012 to find where these abnormal weather events are happening in the US and how they are affecting the number and distribution of bird species. This study will be helpful to highlight the effects of climate change on birds and other living systems and also to predict future negative impacts on wildlife.
There are multiple indicators of a new climate regime, included but not limited to a changing distribution of extreme weather events. Some of these abnormalities are heat waves and severe droughts, which impose pressures on ecosystems. Jessica Gorzo is monitoring these extreme weather events in the contiguous 48 states of the United States and relating them to shifts in bird numbers and distributions.
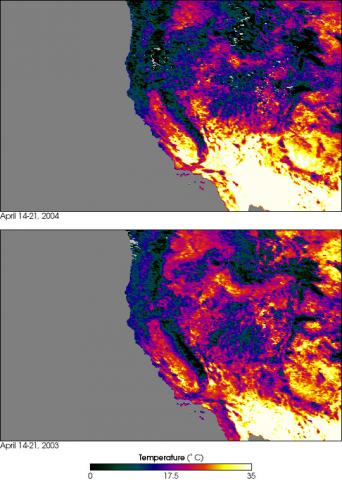
Extreme weather events are observed when analyzing ground weather station data, but these stations exist in a limited number and therefore interpolations are needed to fill the gaps in all the areas where no stations are available. This is why Jess decided to take advantage of MODIS, which collects weather information every day from all over the world, making it ideal to observe current weather changes almost in real time.She considers this satellite data as a great advantage to obtain weather data also from areas where there is no ground weather stations to make a comprehensive analysis. MODIS has been in operation since 2002, which is also an appropriate timeframe to monitor the most recent extreme weather events.Jess is an avid birder and therefore she also wants to find the impact to bird populations caused by extreme weather regimes. She is relating the weather abnormality data with the Breeding Bird Survey to understand relationships with bird populations. She suspects there could be negative consequences of an altered regime of severe weather events, making it difficult or even impossible for bird populations to recuperate their numbers after being decimated due to weather. If the extreme events are happening back-to-back, some species could be in peril since they won’t have time to recover. Hummingbirds have been shown to be especially sensitive to drought, as they depend almost exclusively on flowers.Jess is working in conjunction with other members of the SILVIS lab including Anna Pidgeon, Volker Radeloff, Brooke Bateman-Plumb, Andrew Allstadt and Ana Maria Venegas. They are contributing in the form of weather analysis data, study of shifts in bird distributions, and avian productivity. Tom Albright from the University of Nevada (and former member of the SILVIS lab) is also providing his expertise in desert birds and dry lands climatic variation, making this a robust study.The results of this interesting work will be very useful for multiple reasons. Once the weather time series is created, it could be related with birds and other systems. Therefore it could help to explain and also predict wildlife patterns in response to climate change events. With this information land managers will be the benefit by helping them to find the areas more likely to experience weather abnormalities and allocate efforts to protect high weather sensitive species.
“
Story by Carlos Ramirez Reyes