Posted 01/15/14
Using weather data provides a higher temporal resolution compared to climatic data for producing species distribution models of bird species. This approach provides a much finer resolution of species distributions, and reveal the dynamic nature of the relationship between species and their environment. In addition, weather data models outperformed those using long-term climate data, which varied with guild-level attributes, including migration and feeding.
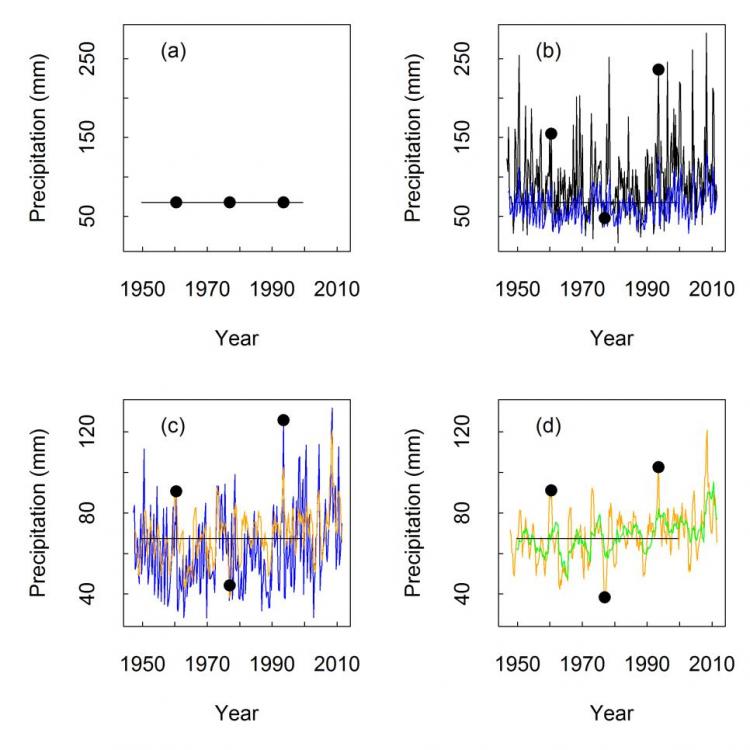
Post-doc Brooke Bateman is taking a new approach to evaluating where birds like to hang out. Typically, when people are trying to predict where certain species occur, they will compare long-term climate data from sighting locations to get an idea of the range of conditions those birds prefer. This information can then be used to map out where suitable environmental conditions for the different species exist, and estimate where on the landscape we can expect to find them. However, the long-term climate data is typically produced by reducing climatic conditions over the past 30-60 years to a single value. Brooke had a hunch that examining weather patterns over a shorter time frame might provide a little more insight into where different species occur. In order to compare the predictive power of climate and weather, Brooke produced two sets of species distribution models; the first using climatic data (averaged over 60 years), and the second using weather data averaged over shorter temporal extents (either 6, 12, or 36 months). She examined a range of climatic variables over this period, including average temperature and precipitation, along with the seasonality and extremes of these two variables. She examined the response at the individual species level, while also looking at effects at the guild level by grouping the species by either feeding or migratory tendencies. While most of the data are freely and readily available, this approach of using a fine temporal resolution required a little additional legwork and a whole lot of extra processing horsepower. But in the end, it appeared to be worth it.
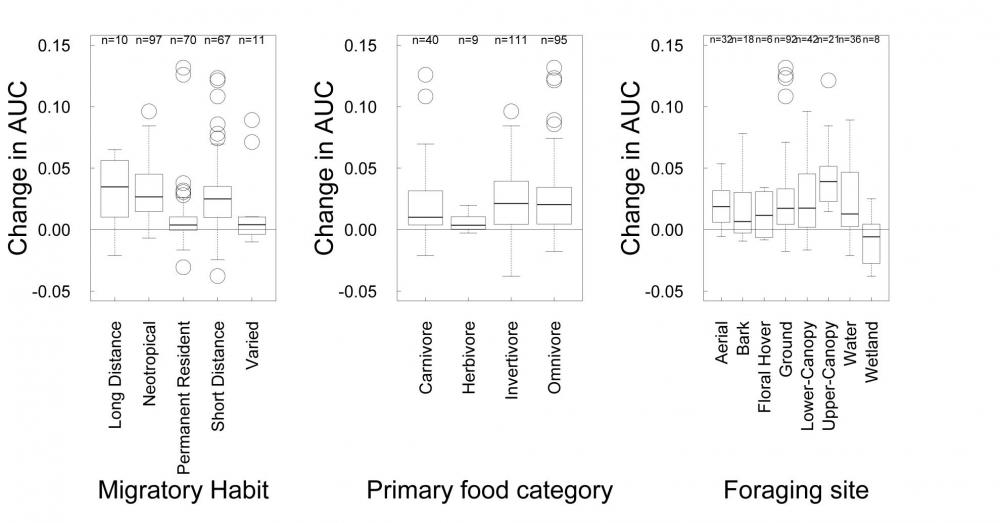
The increased temporal resolution afforded by using the weather data allowed Brooke to identify capture the fluctuations of species niches in geographical space over time that wouldn’t be possible using longer-term climatic averages. She found that some species are sensitive to weather and climate variability and were better modeled using short-term data. This effect was more pronounced in certain guilds; typically the further a species tended to migrate, the more sensitive they were to short term variations in weather conditions, while permanent residents appeared more likely to stay put. In addition, the increased resolution tended to improve the predictive accuracy for certain feeding guilds, such as invertivores and upper-canopy foragers, while others were less sensitive. Brooke hopes that this increase in the accuracy of habitat suitability modeling will be useful in more specifically identifying the conditions required by different species, and help to better identify those conditions that are critical for species of concern, and also identify those areas that benefit the greatest number of species. This information could be then be used in the future to prioritize conservation targets to achieve maximum effect.
“
Story by Steve Wangen