Spatial Analysis For Conservation and Sustainability
Land Use
Land use change is currently the largest threat to biodiversity, and exacerbates the detrimental effects of climate change. We are interested in novel types of land use change, such as housing growth in the WUI, and widespread land abandonment after socioeconomic shocks, and how such changes affect biodiversity.
The United States (U.S.) federal government provides imagery obtained by federally funded Earth Observation satellites typically at no cost. For many years Landsat was an exception to this trend, until 2008 when the United States Geological Survey (USGS) made Landsat data accessible via the internet for free. Substantial increases in downloads of Landsat imagery ensued and led to a rapid expansion of science and operational applications, serving government, private sector, and civil society. The Landsat program hence provides an example to space agencies worldwide on the value of open access for Earth Observation data and has spurred the adaption of similar policies globally, including the European Copernicus Program. Here, we describe important aspects of the Landsat free and open data policy and highlight the importance and continued relevance of this policy.
This article examines the impact of the 1850 Austro-Hungarian customs union on production land-use outcomes. Using newly digitized data from the Second Military Survey of the Habsburg Monarchy, we apply a spatial discontinuity design to estimate the impact of trade liberalization on land use. We find that the customs union increased cropland area by 8 percent per year in Hungary between 1850 and 1855, while forestland area decreased by 6 percent. We provide suggestive evidence that this result is not confounded by the emancipation of the serfs, population growth, or technological change in agriculture.
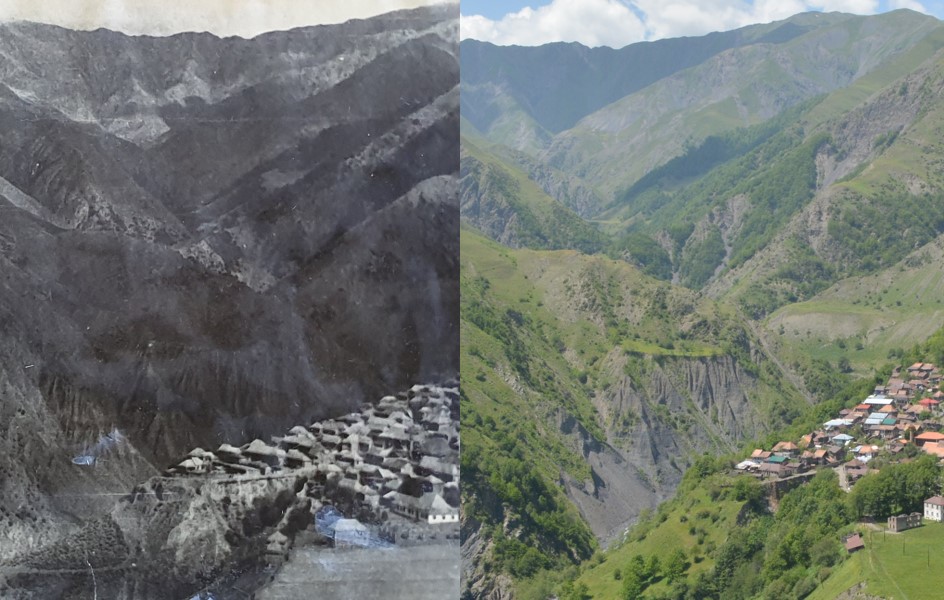
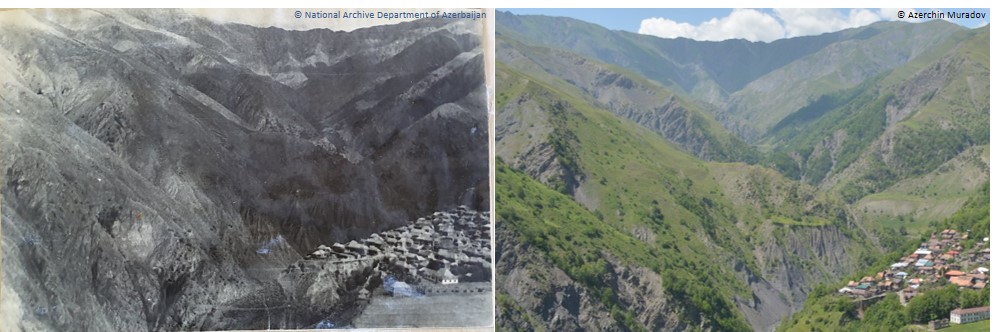
Sarybash village in Azerbaijan and its surroundings with fragments of woody vegetation. Left image: Corona; Right image: recent Google imagery
Humans have altered natural landscapes for millennia, but especially so in recent decades. Recognizing how landscapes have changed over time is critical to understanding the relationship between humans and their environment. In studying this relationship, detailed land cover maps are a key resource. However, to date, there are few detailed land cover maps for the mid-20th century due to of the minimal amount of spatial data available during this time. Afag is developing a novel approach to detailed land cover mapping that will provide more context to mid-20th century landscape changes. Her final maps will incorporate land cover classes such as forest, grassland, agricultural land, water, and urban area.
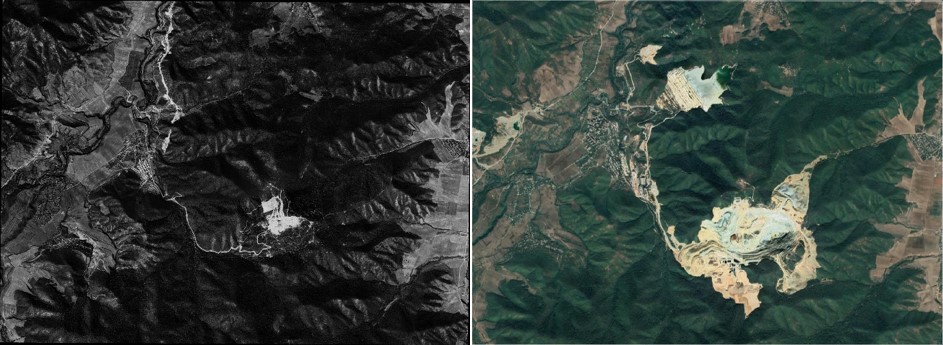
Gold mining in Sakdrisi mountain slopes, Kazreti, Georgia. Left image: Corona; Right image: recent Google imagery
Afag is working on a methodology that will automatically map land cover maps anywhere on the globe from high resolution black and white imagery captured by Corona satellites, i.e., former US spy satellites. Afag is testing her methodology in the Caucasus eco-region encompassing the countries of Azerbaijan, Russia, Georgia, and Armenia, which has diverse ecosystem. This region has areas of extreme elevation and unique biomes. That means that if her methods work in this very diverse region, they should be applicable anywhere. Afag is using object-based image analysis to extract important land use information from satellite data. The classifications are conducted in Google Earth Engine and results in detailed land cover maps.
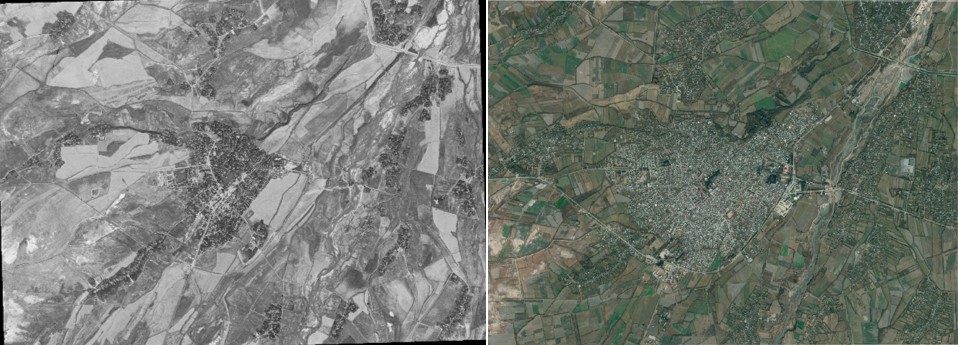
Growth of Aghdash city in Azerbaijan. Left image: Corona; Right image: recent Google imagery
Land cover maps are a valuable for both scientists and land managers. They provide means to evaluate how past land use decisions have affected the current land cover. The maps may also be helpful for projecting future land use changes. Additionally, land use maps can assist in identifying the scale at which politics and wars affect the landscape over time. Ultimately, Afag’s methodology will have the capability to automatically map mid-20th century land cover in large areas across the globe. Her research will help solve tough questions relating to landscape changes over the last half-century.
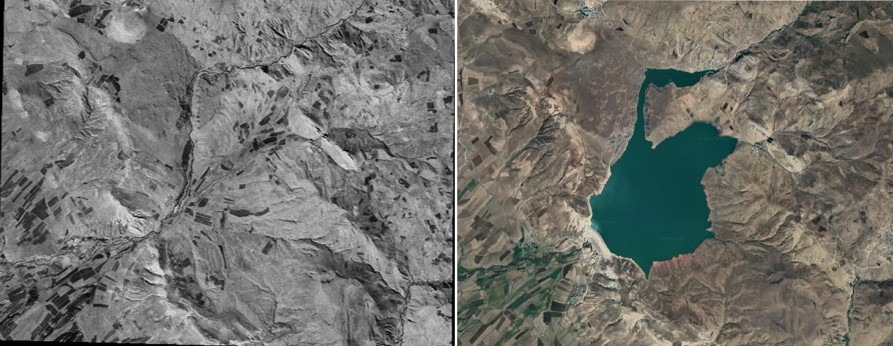
Altınçayır creek dam in Turkey constructed in 1995-2001. Left image: Corona; Right image: recent Google imagery
Habitat connectivity is essential to facilitate species movement across fragmented landscapes, but hard to achieve at broad scales. The enforcement of existing land use policies could improve habitat connectivity, while providing legal support for implementation. Our goal was to evaluate how forest connectivity is affected if forests are restored according to existing riparian buffer regulations in Chile. We simulated forest restoration within 30 and 200 m of rivers in 99 large watersheds, following two sections of the forest regulation. We mapped habitat for two model forest species that have different minimum habitat sizes (15 and 30 ha), and for each we identified forest habitats and corridors using image morphology analysis. To quantify change in connectivity, we used a network graph index, the Relative Equivalent Connected Area. We found that both 30- and 200-m riparian buffers could have a positive effect on habitat connectivity. The 200-m buffers increased connectivity the most where forest cover was 20–40% (40% mean increase in connectivity index), while the 30-m buffers increased connectivity the most where forest cover was 40–60% (30% mean increase in connectivity index). The effect of riparian restoration scenarios was similar for both model species, suggesting that effective implementation of existing forest regulation could improve connectivity for fauna with a range of minimum habitat size requirements. Our findings also suggest that there is some flexibility in the buffer sizes that, if restored, would increase habitat connectivity. This flexibility could help ease the social and economic cost of implementing habitat restoration in productive lands.
Marine turtles may respond to projected climatic changes by shifting their nesting range to climatically suitable areas, which may
result in either increased exposure to threats or fewer threats. Therefore, there is the need to identify whether habitat predicted to
be climatically suitable for marine turtle nesting in the future will be affected by future threats and hinder marine turtles’ ability to
adapt. We modelled the geographic distribution of climatically suitable nesting habitat for marine turtles in the USA under future
climate scenarios, identified potential range shifts by 2050, determined impacts from sea-level rise, and explored changes in
exposure to coastal development as a result of range shifts. Overall nesting ranges of marine turtle species were not predicted to
change between the current and future time periods, except for the northern nesting boundaries for loggerhead turtles. However,
declines in climatically suitable nesting grounds were predicted; loggerhead turtles will experience the highest decreases (10%) in
climatically suitable habitat followed by green (7%) and leatherback (1%) turtles. However, sea-level rise is projected to inundate
78–81% of current habitat predicted to be climatically suitable in the future, depending on species and scenario. Nevertheless,
new beaches will also form, and suitable nesting habitat could be gained, with leatherback turtles potentially experiencing the
biggest percentage gain in suitable habitat.
Mountainous regions are changing rapidly across the world due to both land-use change and climate change.
Given the importance of mountainous regions for ecosystem services and endemic biodiversity, monitoring these
changes is essential. Satellite data provide a great resource to map land-cover change in mountainous regions,
however mapping is especially challenging there because topographic complexity affects reflectance. The socalled
‘topographic effect’ has been successfully corrected for in case studies of small areas, but a comparison of
large-area classifications and land-cover change analyses with and without topographic correction is missing.
Here, we performed a long-term land-cover change assessment for a large mountainous region, i.e., the Caucasus
Mountains with topographic correction. Our two goals were 1) to examine the effect of topographic correction
on land-cover classification for a large mountainous region, and 2) to assess land-cover changes since 1987
across the Caucasus based on the full Landsat archive. Both the complex topography and the history of land-use
changes, especially after the collapse of the Soviet Union in 1991, make the Caucasus Mountains an ideal study
area to understand topographic effects on large-area land-cover mapping for the last three decades. First, we
compared a non-topographically-corrected Landsat classification for 2015 with a classification that was topographically-
corrected with an enhanced C-correction for the same year and assessed the accuracy of both.
Second, we derived topographically-corrected Landsat classifications for six dates to assess changes in cropland
and forest from 1987 to 2015, based on class probabilities and post-classification comparisons. In regard to our
first goal, topographic correction improved the overall accuracy of the classification only by 2% (from 79 to
81%), but disagreement rates were as high as 100% in mountainous regions, especially among forest types. In
regard to our second goal, we found that cropland loss was the most prevalent change process since 1987.
Cropland loss was particularly widespread in Georgia and Armenia until 2000, and in Azerbaijan until 2005. The
North Caucasus (the Russian Federation) had more stable cropland over time, most likely due to different land
reforms after the collapse of the Soviet Union, and the prevalence of flat landscapes and very fertile soils, which
make cultivation easier than in the South Caucasus. Rates of forest change throughout the Caucasus Mountains
were surprisingly low, with forest loss and forest gain being roughly equal. Forest loss was most likely related to
both illegal logging and natural disturbance, whereas forest gain was most likely due to cropland abandonment.
Land degradation affects over one-third of the global land area and is projected to become even more widespread
due to climate change and land use pressures. Despite being a critical issue for climate change mitigation,
biodiversity conservation, and food security, the detection of the onset, duration, and magnitude of land de-
gradation remains challenging, as is early identification of short-term vegetation loss preceding land degrada-
tion. Here, we present a new approach for monitoring both short-term vegetation loss and decadal degradation
in grasslands using satellite data. Our approach integrates Spectral Mixture Analysis and temporal segmentation,
and analyzes dense time-series of satellite observations in three steps. First, we unmix all available satellite
observations and aggregate them into monthly composites. Second, we calculate the annual Cumulative
Endmember Fractions and examine their piecewise trends among years to determine the onset, duration, and
magnitude of short-term vegetation loss and decadal degradation. Third, we attribute a decrease in the green
vegetation fraction with a concomitant increase in either open soil, or non-photosynthetic vegetation. We tested
our method mapping short-term vegetation loss and decadal degradation in grasslands in the Caucasus Ecoregion
using the 2001–2018 time series of MODIS 8-day reflectance data. We found strong patterns of short-term
vegetation loss and decadal degradation, mostly in the eastern part of the Caucasus Ecoregion in areas of desert-
and semi-desert natural vegetation. Short-term vegetation loss episodes (3–9 years) were more common and had
greater magnitude than decadal degradation (≥10 years), especially in steppe regions. On average, 9.3% of
grassland area was subjected annually to either decadal, or short-term vegetation loss. Desiccation, i.e., the shift
from green vegetation to dry vegetation, was the most prevalent type of change pathway, with green vegetation
loss to open soil coming second. Decadal degradation and short-term vegetation loss rates were the highest in dry
areas where the potential natural vegetation is sub-shrub deserts, or halophytic, alluvial, and wet lowland
forests. Our findings support known general degradation patterns in the Caucasus Ecoregion, but provide better
understanding of ongoing processes, by detecting exact location, timing, and magnitude of changes. More
broadly, our method advances the monitoring of grasslands by detecting both decadal degradation and short-
term vegetation loss. This flexibility supports adaptive degradation monitoring, aids sustainable land manage-
ment, and provides new information for carbon stock analyses and biodiversity conservation.
The expansion of forest plantations is cause for concern because of their environmental effects, and the loss of native forests and agricultural land. Our goal was to quantify the increase in pine plantation, and concomitant loss of native forests, in central Chile since ca. 1960, and to identify in which settings native forests were lost most rapidly. We analyzed aerial photographs from 1955 and 1961, Landsat images from 1975 and 1998, and Google Earth high-resolution satellite images from 2014. To ensure high classification accuracy, we visually interpreted images for a systematic 3-km grid and assigned each point as either ‘pine plantation’, ‘native forest’, ‘agricultural-livestock lands’, or ‘other’. We also calculated latitude, longitude, slope, Euclidean distance to the nearest road and to the nearest pulp mill, and the frequency of land use surrounding each point as potential variables to explain observed land use changes. Pine plantations expansion started even before 1960, when 12% of all points were already pine plantations, was particularly rapid from 1975 (18% of sample points) to 1998 (38%), and stabilized thereafter (37% by 2014). From 1975 to 1998 alone, 40% of native forests were replaced by pine plantations, and agricultural-livestock lands declined by 0.7%, 0.9%, 1% per year before 1975, from 1975 to 1998, and after 1998 respectively. Native forests that were surrounded by pine plantations, were most likely to be converted to plantations, and from 1960 to 1975, also native forests near pulp mills. The probability of change from agricultural-livestock lands to pine plantations was mainly influenced by slope, with most agricultural-livestock lands remaining in areas with low slopes.
In the past decade, concern for forest loss has spurred ambitious restoration goals for climatic, ecological, and livelihood benefits. Restoration activities typically rely on government-led or large-scale tree planting. A narrow focus on top-down initiatives could promote the recentralization of forestry activities and overlook important contributions by smallholders, especially in Africa. Smallholder tree planting activities are harder to track than institutional efforts. Here we quantify the extent of tree planting on smallholder woodlots in southern and eastern Tanzania, in comparison to large-scale plantations. In Google Earth Pro, we digitized all woodlots in randomly selected areas, and estimated woodlots' area, distribution, and expansion rate. We found that by year 2018, woodlots in the smallest size class (< 1 Ha) made up about half of the overall tree planting extent, covering an area equivalent to the government and corporate plantations. What's more, smallholder woodlots have been planted more recently: 54% of the digitized samples were planted between 2012 and 2015, a sign of woodlots' rising prominence. The vast majority of all planted trees were non-native pine and eucalyptus. Thus far, Tanzanian smallholders are planting trees in response to regional timber demand. Subsidies or incentives linked to global restoration goals could encourage more diverse planting and longer harvesting cycles. Given African countries' recent massive restoration pledges (e.g., Tanzania's 5.2 M Ha), we recommend explicit incorporation of smallholder tree planting to maximize livelihood and governance benefits.
Ecotourism is developing rapidly in biodiversity hotspots worldwide, but there is limited and mixed
empirical evidence that ecotourism achieves positive biodiversity outcomes. We assessed whether ecotourism
influenced forest loss rates and trajectories from 2000 to 2017 in Himalayan temperate forests. We compared forest
loss in 15 ecotourism hubs with nonecotourism areas in 4 Himalayan countries. We used matching statistics to
control for local-level determinants of forest loss, for example, population density, market access, and topography.
None of the ecotourism hubs was free of forest loss, and we found limited evidence that forest-loss trajectories in
ecotourism hubs were different from those in nonecotourism areas. In Nepal and Bhutan, differences in forest loss
rates between ecotourism hubs and matched nonecotourism areas did not differ significantly, and the magnitude
of the estimated effect was small. In India, where overall forest loss rates were the lowest of any country in
our analysis, forest loss rates were higher in ecotourism hubs than in matched nonecotourism areas. In contrast,
in China, where overall forest loss rates were highest, forest loss rates were lower in ecotourism hubs than
where there was no ecotourism. Our results suggest that the success of ecotourism as a forest conservation
strategy, as it is currently practiced in the Himalaya, is context dependent. In a region with high deforestation
pressures, ecotourism may be a relatively environmentally friendly form of economic development relative to
other development strategies. However, ecotourism may stimulate forest loss in regions where deforestation rates
are low.